


Chapter 3: Demand and Supply
A market exists anywhere there are buyers willing to buy a good and sellers willing to sell it. Markets are pervasive institutions of trade.
A market can be a physical location, like a grocery store, gas station, or bakery. Markets also exist in cyberspace at sites like eBay, Amazon, Monster.com, etc.
Markets can be very formal, involving legal contracts specifying the terms and conditions of a trade, or they can be informal, where deals are sealed with no more than a handshake.
Markets are used to trade everything from cars and books to labour services and music.
Despite their many forms, all markets have a similar basic structure. Economists use a model called demand and supply to explain the interactions of buyers and sellers in markets and to make predictions about the prices of quantities of goods bought and sold.
Demand: The relationship between the price of a good and the quantity of the good that buyers are witting and able to buy at that price.
Quantity demanded: The amount of a good that buyers are willing and able to buy at a given price.
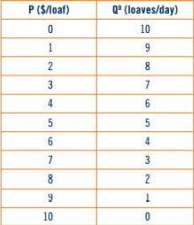
We can illustrate the concepts of demand and quantity demanded using a table or a graph. Let's start with a table. The table below shows the hypothetical demand for loaves of bread per day at a local bakery.
The column labelled P shows cite price of each loaf of bread.
The column labelled Q shows the quantity of bread demanded at each price.
It tells how many loaves consumers will be willing and able to buy per day at each possible price and holding all other things constant.
When the price of bread is $3 per loaf, for example, the bakery's customers are willing and able to buy 7 loaves per day.
For the graph of demand of loaves per day, price is measured on the y-axis and quantity is measured on the x-axis of the graph.

The law of demand is an inverse relationship between price and quantity demanded.
The income effect implies that changes in the price of a good affect the amount of it that you can afford, which results in a change in quantity demanded.
The law of demand arises from the substitution effect, which describes how you respond to changes in relative prices.
A relative price is a good's price in comparison to the prices of other goods you could buy.
For example, because the increase in the price of bread makes bagels seem relatively cheaper, you may respond to the higher price of bread by increasing the amount of bagels you buy.
This is the consumer substitution effect of the increase in price.
The substitution effect tells us that you will respond to a higher price of a good by decreasing your quantity demanded of that good and substituting instead into goods whose prices have not changed.
The law of diminishing marginal utility also contributes to the law of demand.
According to the law of diminishing marginal utility, people obtain less satisfaction from each successive unit of a good consumed; consequently there is a decrease in their willingness to pay for additional units of the good.
The law of diminishing marginal utility is an alternative way to explain the demand for goods and services, as represented by the demand curve.
We can view demand as describing how much of a good consumers are willing and able to buy at a given price.
Thinking of it as a "horizontal" interpretation in the sense that demand shows the quantity demanded, measured on the horizontal axis, for a given price.
Another way to think about demand is that it is the maximum amount that consumers are willing and able to pay to obtain each unit of a good.
This is a "vertical" interpretation of demand in the sense that it shows the dollar amount, measured on the vertical axis, of consumers willingness to pay for each unit of the good consumed,
As an example of the law of diminishing marginal utility, imagine that you walk into the bakery to buy a bagel for your lunch. Because you are hungry and you expect that a bagel will satisfy your hunger, you are willing to pay a lot for the bagel.
After you finish that first bagel, you have the choice of purchasing a second bagel.
Chances are you won't expect as much satisfaction from the second bagel as you did from the first, primarily because some of your hunger has been satisfied.
In other words, you expect that your marginal utility will be smaller for the second bagel than it was for the first bagel.
As a result, you would not be willing to pay as much for the second bagel as you did for the first bagel.
Similarly, as you consume a third and fourth bagel, your willingness to pay for additional bagels will fall incrementally.
The price you are willing to pay for a bagel falls with the more bagels you consume.
A change in the quantity demand results from a change in the price of the good. It is represented by a movement along the demand curve.
An increase in demand means that quantity demanded increases at each price. As a result, the demand curve shifts outward to the right.
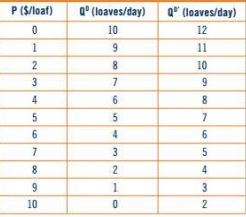
For increase in demand, we take the example of the loaves of bread per day at the bakery again.
At each price, the new demand curve, D', lies to the right of the old demand curve, illustrating an increase in the quantity demanded at each price.
The new table and graph are shown below:

A decrease in demand means that quantity demanded decreases at each price. As a result, the demand curve shifts inward to the left.
For, decrease in demand, the graph moves back from D’ to D since it now move to the left.
The effect of a change in income on demand depends on whether the good is a normal good or an inferior good.
For normal goods, increases in income cause demand to increase. Most goods tend to fit into this category.
For inferior goods, increases in income cause demand to decrease.
Individual preferences determine whether goods are normal or inferior for a particular person.
Complement goods are goods that tend to be used together. Examples of complement goods include iPods and iTunes downloads, ski equipment and ski passes, and bread and peanut butter.
When the price of peanut butter, a complement to bread, falls, the quantity demanded of peanut butter rises and in turn the demand for bread rises.
Tastes and preferences describe people's opinions about a good. They can reflect trends, marketing influences, or culture. The effect of tastes and preferences on demand is pretty straightforward. If it becomes trendy or fashionable, the demand for it increases.
When we build a demand curve, we can describe the behaviour of an individual or the behaviour of all of the consumers in a market. If the number of consumers for your goods increases, the overall demand for it will also increase.
In the demand and supply model, supply represents the seller's side of the market. The fundamental relationship on the supply side is between the price of the good and the quantity that sellers are willing and able to sell at that price.
This quantity is called the quantity supplied, and it changes as the price of the good changes.
As with demand, letting the price of the good change and then observing the resulting changes in quantity supplied yields an overall relationship between price and quantity supplied, called the supply of the good.
Quantity supplied is the amount of a good or service that sellers are willing and able to sell at a given price.
Each quantity supplied is one point in the supply table or one point on the supply curve.
Supply shows us all the prices and all the quantities supplied in the entire table or graph.
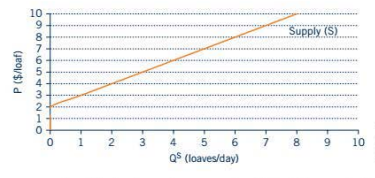
As in the demand graph, price is measured on the y-axis and quantity is measured on the x-axis, the line connecting each of the price and quantity supplied combinations is called a supply curve and is labelled S. Taking the example of supply of loaves of bread per day, the supply graph is shown below:
The positive relationship between the price of a good and its quantity supplied is called the law of supply.
There are several factors that contribute to the positive relationship between price and quantity supplied: the scale effect, the substitution effect, and the law of increasing marginal costs.
The scale effect implies that when the price of a good rises, producers increase their quantity supplied because they can afford to increase their scale of production. When the price of a good falls, producers decrease their quantity supplied because they cannot afford to keep up their current scale of production.
The producer substitution effect of a price increase occurs when changes in the relative price of a good cause producers to move their production into the now relatively higher priced goods.
The law of increasing marginal costs asserts that the costs of production tend to rise as successive units of a good are produced. These increasing costs are then reflected in increases in the minimum prices that producers are willing to accept for the good as quantities of the good increase.
Increasing marginal cost arises because resources are specialized- they are not equally productive at producing at goods and services.
Taking the case of bread baking, the costs of bread production increase as we produce more bread for several reasons.
First, we will likely use our best baker to produce the first batch of bread.
He is highly efficient and can make his way around the kitchen quickly.
To produce the second batch of bread, our next best baker is used.
She is not quite as skilled as our first baker, so it takes her longer to produce the bread.
Because it takes her longer, it costs us more in time and wages to make the second batch of bread.
By the time we move on to our third baker, the kitchen is getting crowded, it is harder to make the bread as quickly, and so it takes even longer to produce the third loaf.
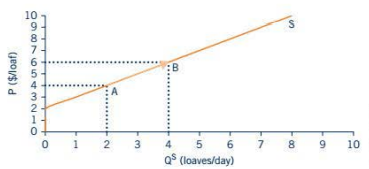
It is important to distinguish between a change in quantity supplied of a good and a change in the supply of the good. When the price of a good changes, only the quantity supplied, but not the overall supply, of the good changes.
For example, suppose the price of bread is initially $4 per loaf, so that quantity supplied is 2 loaves per day. The P = $4 and Q' = 2 pair of values corresponds to point A on the supply curve.
If the price rises to $6 per loaf, the quantity supplied increases to 4 loaves per day, shown by point B.
When the price of bread changes, the quantity supplied changes, and there is a movement along the supply curve for bread.
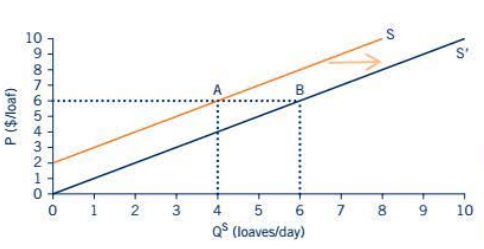
In column Q(s’) of the table below, when the price of bread is $6 per loaf, quantity supplied is now 6 loaves per day rather than 4 loaves per day.
When the price is $3 per loaf, quantity supplied is 3 loaves per day instead of 1 loaf per day.
Because the quantity supplied increased at each price, the points on the new supply curve S' are to the right of those on the original supply curve S, as shown in the graph below.
An increase in supply generates an outward shift in the supply curve.
A change in supply then, implies a fundamental change in the overall supply relationship- a new column of the supply table is needed and the supply curve shifts.
In comparison, a change in quantity supplied which comes only from a change in the price of the good, does not imply a change in the overall relationship but rather a movement within the relationship.
A decrease in supply is reflected in movements in the opposite direction.
If supply decreases, quantity supplied at each price is less than before. This is illustrated by moving from Q(s’) to Q(s).

An increase in supply means that quantity supplied increases at each price. As a result, the supply curve shifts outward.
A decrease in supply means that quantity supplied decreases at each price. As a result, the supply curve shifts inward.
The expenses involved in production include the costs of inputs, the costs to get goods or services to market, and the technology used to produce the goods and services.
When the costs of production of a good or service increase, ceteris paribus, the supply of the good or service will decrease.
The supply of a good can change when the price of alternative goods that use similar resources changes
As with demand, supply can change in response to changes in producers' expectations about the future. When producers expect sales to increase in the future, they may increase their production today in order to have adequate inventories.
As the number of sellers in the market rises, the market supply of a good rises.
When buyers can obtain all of the good that they are willing and able to buy at a given price and sellers can sell all of the good that they are willing and able to sell at a given price, the market is in equilibrium.
Taking the example of the demand and supply of bread, when the market is in equilibrium, the quantity demanded and the quantity supplied are equal to one another at a given price.
At point E, the price is $6 per loaf and Q(s) and Q(D) are both 4 loaves per day.

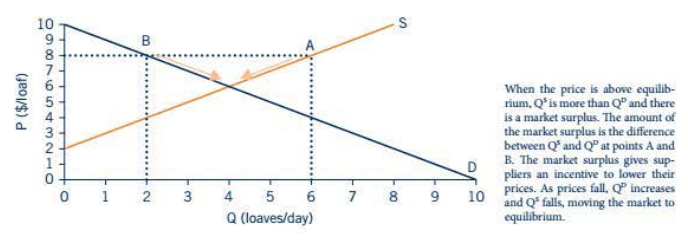
Market surplus occurs when the price of a good is above its equilibrium price.
Market shortage occurs when the price of a good is below its equilibrium price.
The graph below illustrates the market surplus and market shortage using the bread loaf example.
New technological innovations might increase supply or lower production costs, consumers move to new markets, consumers and producers may alter their expectations- all these shifts in demand and supply affect price and quantity and move the market away from equilibrium.
In response to changing prices, quantity demanded and quantity supplied adjust to move the market to a new equilibrium price and quantity.