
Ch 5 - Elasticity, Taxation, and Consumer Choice
(Microeconomics)
The law of demand stresses that consumers will buy more of a product in the case when price falls and demand will decrease if the price decreases
This could be better understood by comprehending elasticity, which analyses the responsiveness of consumers and producers as a change of price occurs
Elasticity of Demand
Elasticity is the measure of how consumers respond to changes in price
The main and basic rule of elasticity is that a price change leads to a large change in quantity demanded, which is relative to the price change
Formula:
Price Elasticity of Demand (Ed) = % change in Quantity Demanded (Qd) / % change in Price (P)
The percentage change in Price or Qd is calculated by using this formula: Change in P or Qd / Initial P or Qd
Another way to calculate the percentage change is by taking the new number minus the old divided by the old number. This can be denoted by: N - OOO (New - Old Over Old)
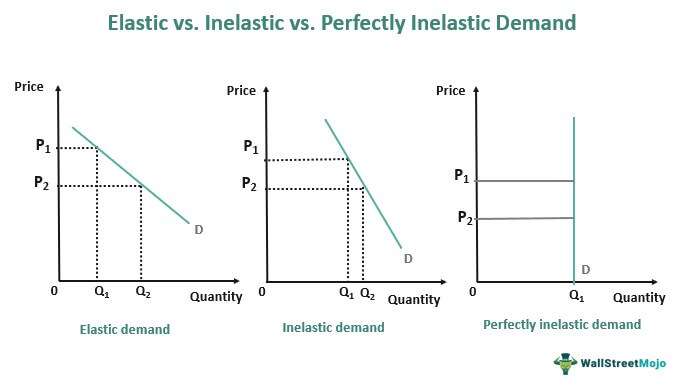
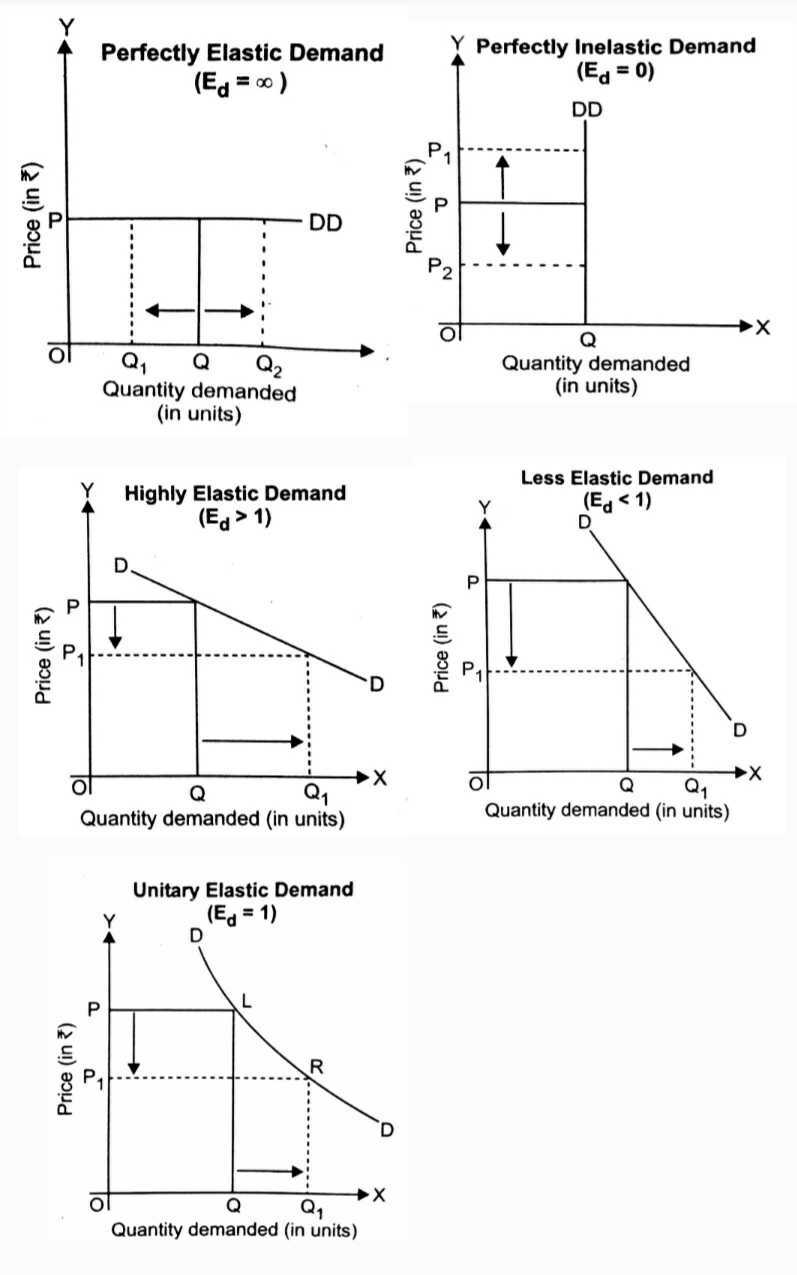
The point of using this formula is to find the type of elasticity, which is represented by values.
Total Revenues Test to Determine Elasticity
Type of Elasticity | Elasticity Value |
|---|---|
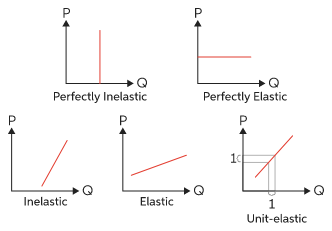
Perfectly Inelastic | = 0 |
Unit Elastic | = 1 |
Relatively Inelastic | < 1 |
Relatively Elastic | > 1 |
Perfectly Elastic | Infinity |
Tips for finding the elasticity value:
Find the difference between the Demand and Price
Add the original numbers, then divide by 2 to find their midpoint
Divide the difference of both demand and price by the new midpoint number found in step 2
Divide the answer for demand by price
Check the type of elasticity based on the answer given in step 4
Now we know how to find the value of elasticity, however, what is the purpose of understanding elasticity?
It is important for firms as it affects their revenue and profits. Total revenue is the amount of money received from sales of a product
Equation: TR = P * Q
Total revenue = Price * Quantity
Perfect Elasticity
If the price increases and total revenue decreases, elasticity of demand is relatively elastic
If price increases and total revenue increases, elasticity of demand is relatively inelastic
If price changes and total revenue remains the same, elasticity of demand is unit elastic
As price changes, the change in quantity demanded is infinite, and the elasticity of demand is perfectly elastic
Types of Elasticity | Relationship between Price and Total Revenue |
|---|---|
>1, Relatively elastic | P and TR are inversely related |
<1, Relatively inelastic | P and TR have a direct relationship |
= 1, Unit elastic | TR does not change when P does |
Tips:
Perfectly Elastic demand will be horizontal on the graph, while Perfectly inelastic demand will be vertical on the graph
It it helpful to remember inelasticity as being insensitive to changes in price
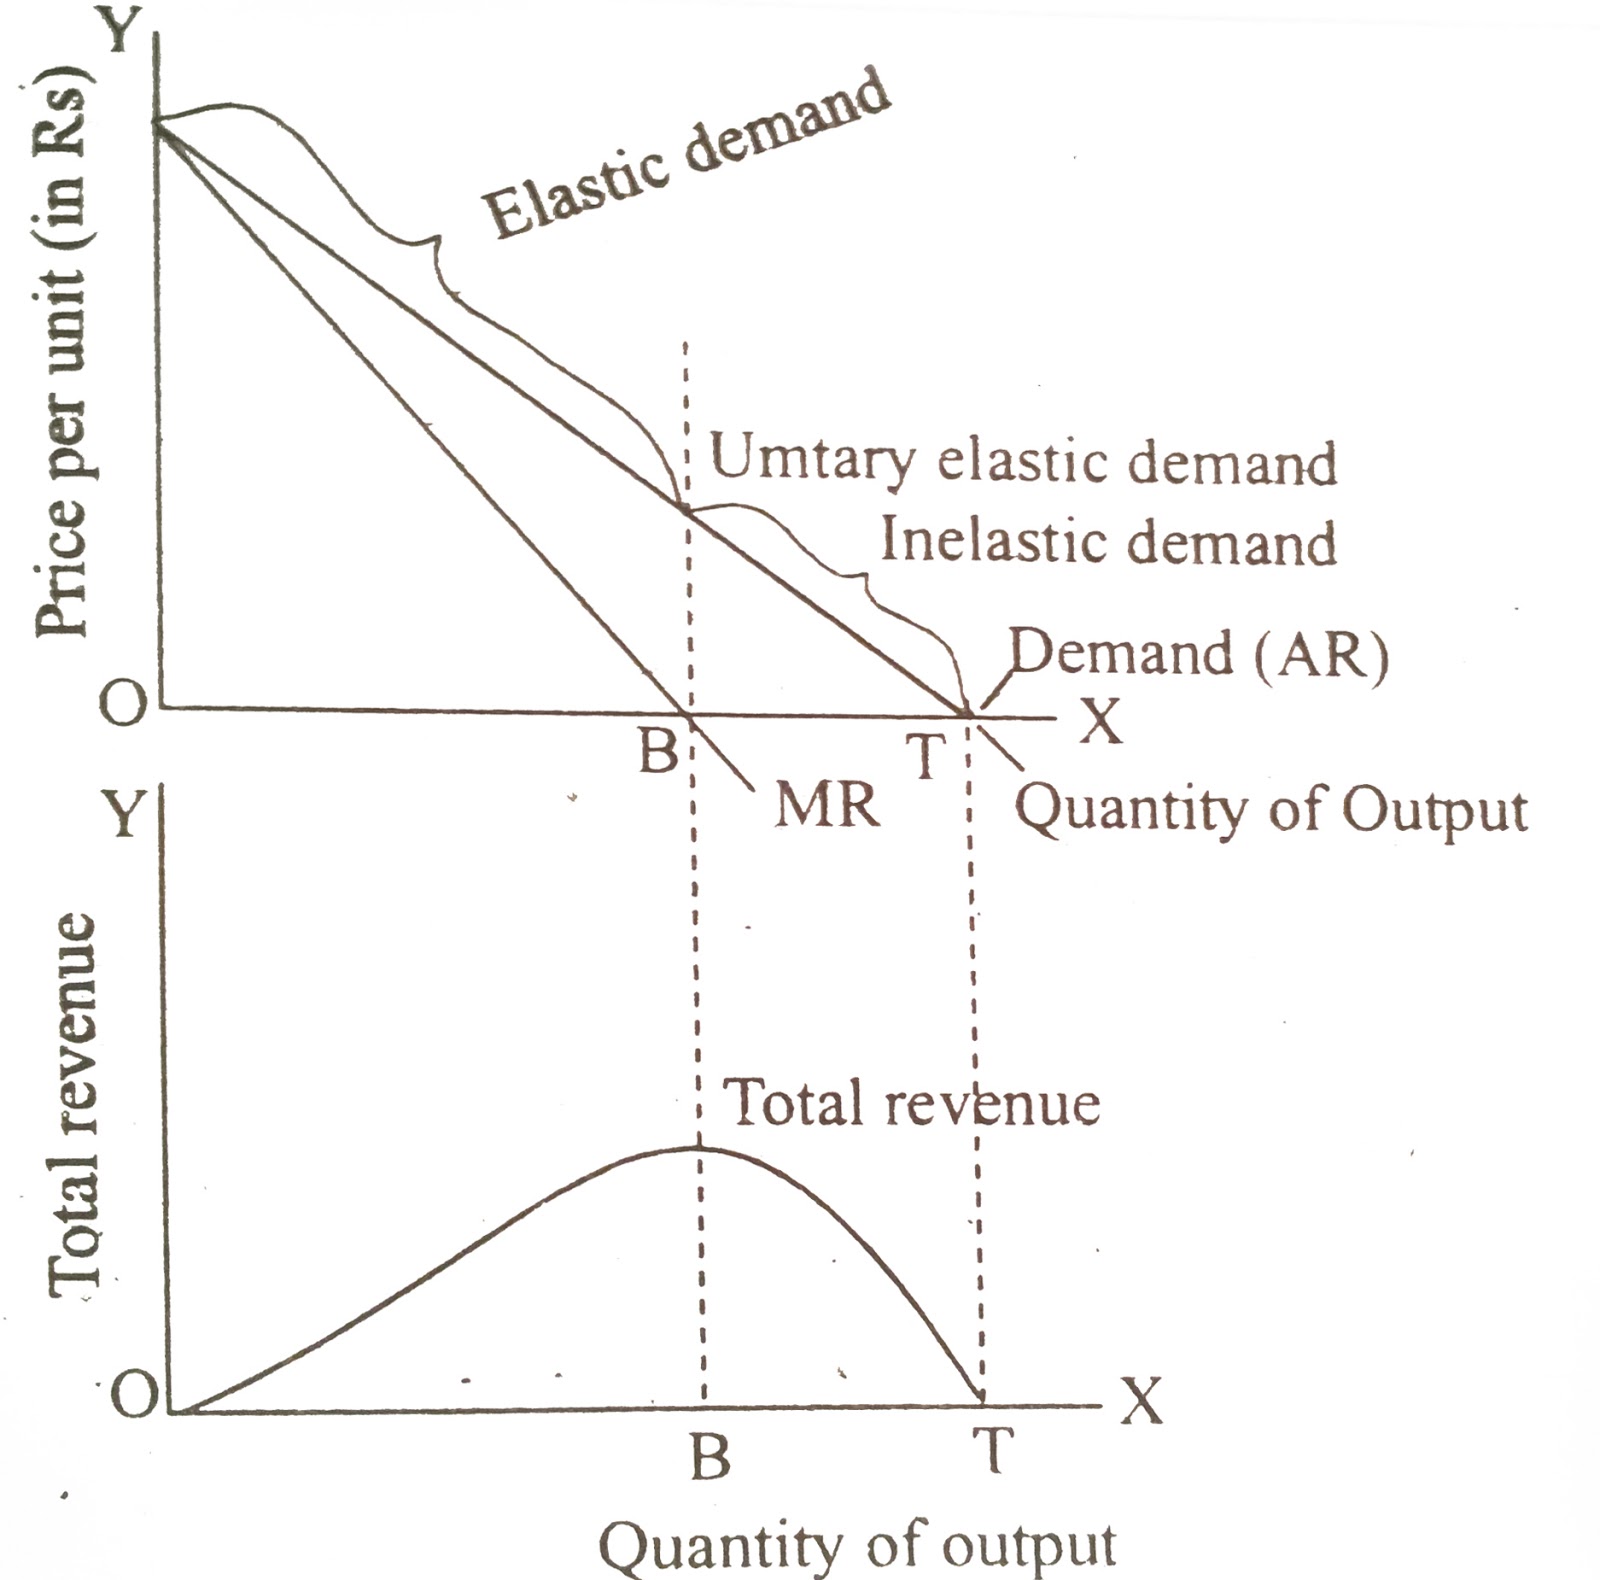
As a general rule, it is helpful to think of the top portion of the demand curve as the elastic range, and the lower section to be the inelastic range
As price decreases in the inelastic range, the total revenue falls. We can see this being applied in monopoly as well, as a monopoly is produced in the elastic range of the demand curve
How to determine Demand Elasticity?
If there is a necessary good without any substitutes, a consumer is more likely to buy the same quantity as the price changes. This is because these necessary goods cannot be substituted and are essential to buy, which is why they will not be affected by changes in price. This leads to inelastic demand, and we can analyse a graph based on this as well
If purchasing this good can be delayed, or consumers have a longer time trying to make a decision, the demand for the good is more elastic. Meaning that it is subject to be susceptible to changes in price. However, if consumers are not able to delay purchasing this good, the demand will be inelastic
If a certain good requires a large portion of one’s budget, the good will generally be more elastic. The higher the price of luxury goods, the lower the incentive to purchase this good will be, and therefore, less quantity will be demanded.
Cross Elasticity of Demand (CPED):
This measures how the changes in price of a certain good can affect the quantity demanded of another product. The result of this calculation is to find out if product are complementary or substitute goods. If the result is positive, the two goods are substitutes, if the result is negative, the goods are complements
Substitute goods are those which can be exchanged with one another. For example, different brands of bread are substitute goods as they provide the same product which can be interchanged with another.
Complementary goods are those with complement each other. For example, gas and cars are complementary, as we cannot use one without the other.
Formula: CPED = % change in QD of Product X / % change in Price of Product Y
QD is divided by Price. A negative output means that the goods are complementary, while a Positive output means that the goods are substitutes
Income Elasticity of Demand:
Another factor which affects the purchasing activity of consumers is income. Consumers have to take into consideration their own budget before purchasing goods and services. Elasticity is determined based on their sensitivity and response to changes in price. The formula can be used to determine how the changes in income affect the quantity demanded of a good
Formula: IED = % change in QD / % change in Consumer income
The result of the formula conveys whether a good is an inferior or normal good.
With normal goods, there is a direct relationship between an individual’s income and the quantity demanded. An increase in come creates an increase in quantity demanded, since consumers have more money to spend.
With inferior goods, an increase in income leads to a decrease in quantity demanded, as they appear to have an inverse relationship. The ratio for normal goods will have a positive sign, and the ratio for inferior goods will have a negative sign
Price Elasticity of Supply (PES):
The price elasticity of supply takes into the consideration how a change in price affects the quantity supplied. (Elasticity values are the same as those of demand).
The longer firms have to adjust, the more elastic their supply curve will be. This leads to difficulty for many firms to increase production of goods in the short term.
In the long run, a market or industry supply curve is usually perfectly elastic. This is relevant when studying perfect competition.
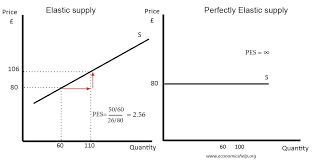
In Fig.2, the perfectly inelastic supply conveys that a change in price leaves the quantity supplied unchanged, whereas the perfectly elastic supply will remain unchanged and unaffected by changes in price.
Formula: PES: % change in QS / % change in price
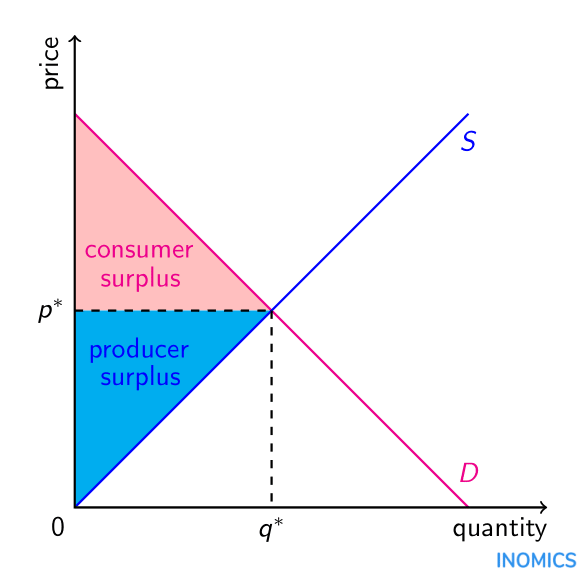
Consumer and Producer Surplus:
Consumer surplus is the difference between the highest price a consumer would pay for a product minus the actual price paid. This surplus is calculated in order to measure the social benefits of public goods. On a graph, Consumer surplus can be located below the demand curve , above price, and left of quantity.
Producer surplus is the difference between the lowest price a producer would sell a product and the actual price received. On a graph, producer surplus can be located above the supply curve, blow price, and left of quantity.
When consumer and producer surpluses are maximised, the economy will experience efficiency and therefore lead to equity.
If a demand curve is perfectly elastic, there will be no consumer surplus, and if a supply curve is perfectly elastic, there is no producer surplus
Government Intervention: Price ceiling and Price floors
When the prices of goods or services lead to inequality and inefficiency in the market, the government has to intervene and set policies to fix this. Some producers set prices in a way which only acts in their self interest.
A price ceiling is a maximum legal price that can be charged for a product or service. Price ceiling is exactly as the name suggests, it is the maximum price which can be set on any goods or services. This allows for more equity in the market, as well as sets a clear equilibrium for producers to maintain. The limit may displease producers, which leads them to convert their policies to ones which will eventually benefit the market.
An example of this would be when governments set a maximum price for rent prices (rent control)
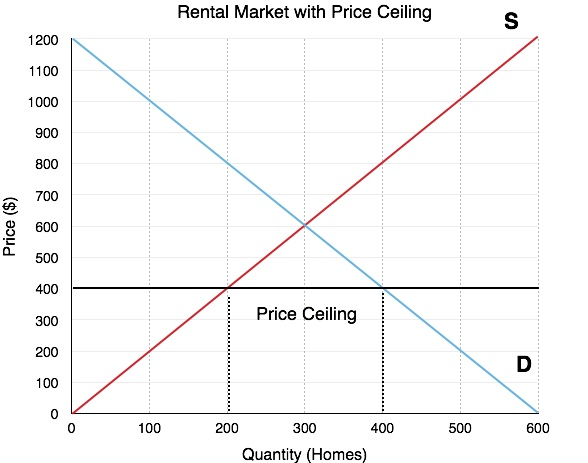
On the other hand, any price set under the ceiling will create a shortage as the quantity demanded will exceed the quantity supplied. In some cases, the price ceiling will not fix disequilibrium.
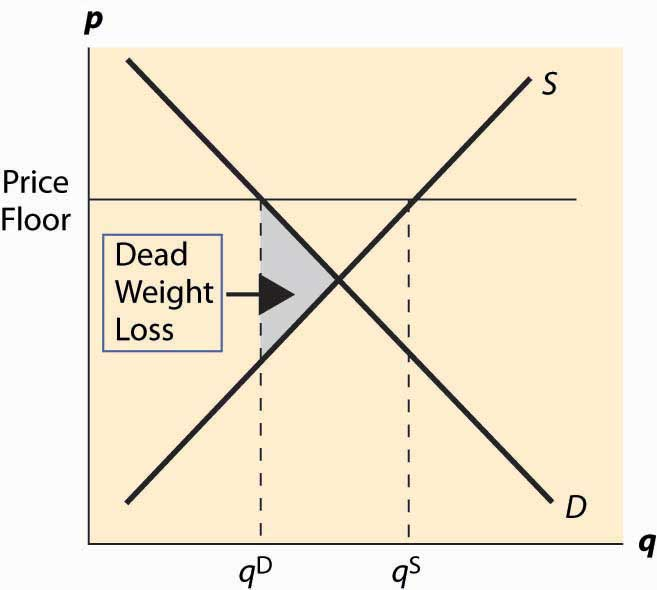
A price Floor is a minimum legal that can be charged for a product or service. This policy is set when the government believes that producers are not receiving enough income. For example, the government can set price floors to support farmers and adjust minimum wage.
Effects of this intervention is that there will be a surplus due to the competitive equilibrium price. Producers will produce too much of that good which leads to a surplus of goods.
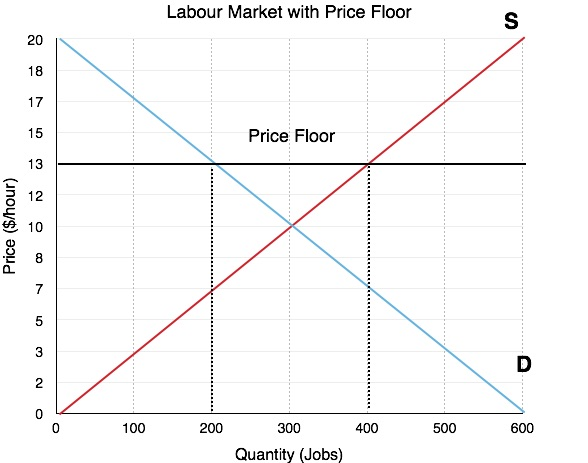
Tip: Remember that a price ceiling is only valid if it is placed below the equilibrium price, otherwise, it will not be effective. A price floor will only be functional if it is place above the equilibrium price.
Deadweight Loss with a Price Ceiling
When a market fails to maximise total surplus, a deadweight loss is created. (total surplus is the sum of consumer and producer surpluses)
Deadweight loss is the loss of total surplus when a market fails to reach a competitive equilibrium.
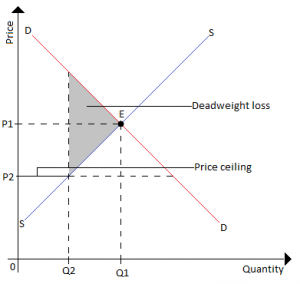
When excess demand is coupled with supply shortage, producers refuse to set their goods at a lower price and consumers begin to demand cheaper goods, which creates a deadweight loss of inefficiency
Deadweight loss with a Price Floor
A maximum price is set above the competitive market price. The deadweight loss here is the difference between values of units which are not traded. This is basically the leftover goods and services which have not purchased in the market
This is a cost to society which is created by market inefficiency, and it occurs when supply and demand are out of equilibrium
Impact of Taxes on Consumer and Producer Surpluses
Taxation is a form of government intervention as they need to take a portion of your income to be able to improve public goods and services. Taxation does result in a reduction of total surplus (deadweight loss). Also, its effects vary depending on consumers and producers and their respective price elasticities of demand or supply.
An Excise tax is a per unit tax on the production or sale of a good. The tax revenue portion of a tax graph is not part of the deadweight loss, as this money is revenue for the government.
The responsibility of paying taxes is split between producers and consumers, and the portions are related to price elasticity of demand and supply. If supply is more elastic than demand, consumers are responsible for a greater percentage of the tax than suppliers. While if demand is more elastic than supply, sellers pay more of the tax.
Governments tend to place more tax on goods which have inelastic demand, since consumers will purchase the good regardless of its price
Tip: The curve that is more price inelastic pays more of the tax, meaning that price elastic goods and services on the curve pay less
Elasticities | Who will Pay the Tax? |
|---|---|
Elasticity of Demand > Elasticity of Supply | Producers will pay more tax than consumers |
Elasticity of Demand < Elasticity of Supply | Consumers pay more tax than producers |
Perfectly Inelastic Demand (Ed=0) | Consumers pay all the tax |
Perfectly elastic demand (Ed=infinity) | Consumers pay none of the tax |
Perfectly inelastic supply (Es=0) | Producers pay all of the tax |
Perfectly elastic supply (Es=Infinity) | Producers pay none of the tax |
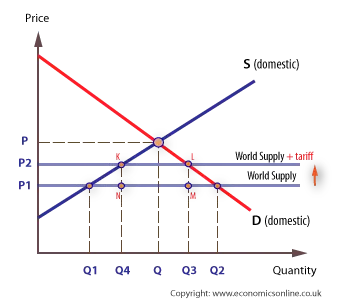
Trade, Tariffs, and Quotas
All taxes create a deadweight loss. A tariff is a tax on imports or exports, and a quota has a similar effect on trade that sets a limit on the quantity of goods imported and exported. After the tariff, the quantity of imports decreases, and areas where consumer surplus before trade are now tax revenue from the tariff and deadweight loss
Consumer Choice theory
Total Utility: the total utility amount of satisfaction a person receives from the consumption of a good or service
Marginal Utility: extra amount of satisfaction or utility from consuming one more unit of a good or service
Total utility is at its highest point when marginal utility is zero. Total utility increases at a decreasing rate and eventually declines, marginal utility is the change in total utility and decreases with each increase of a good and turns negative when total utility is failing
The Utility-Maximisation rule states that a consumer maximizes utility when the marginal utility per dollar spent for all items is equal given budget constraints.
Consumer choice theory includes many factors, which are necessary to help them make choice accordingly.
Using the Utility- maximisation rule | Using the Utility- maximisation rule |
|---|---|
If MU/Px > MU/Py | Buy more of x and less of y |
if MU/Px < MU/Py | Buy more of y and less of x |
if MU/Px = MU/Py | Maintain current consumption level |