
Ch 11 - Government and Public Sector: Market Failure, Externalities, Public Goods, Efficiency
((Microeconomics)
Misallocation of resources is one of the main reasons for the lack of efficiency in the allocation of resources. When firms produce too little or too much of something, it either leads to inefficiency or misallocation. Both of these factors result in Market failure.
Market failure: when a market fails to provide an efficient allocation of resources, and there can be a role for government to intervene and attempt to promote a more desirable social outcome.
Market Failure and Externalities
The government intervenes in the market in order to increase efficiency by improving market failures and correcting the production where it will be marginal social benefit (MSB) = marginal social cost (MSC)
Market production would be efficient when MSB = MSC, therefore, when there is market failure, firms fail to produce at this point, which leads to externalities.
Externalities: the costs or benefits that affect people ot involved in the production or consumption of a good
When MSB = MSC
The point where MSB = MSC indicates that there is an optimal level of production
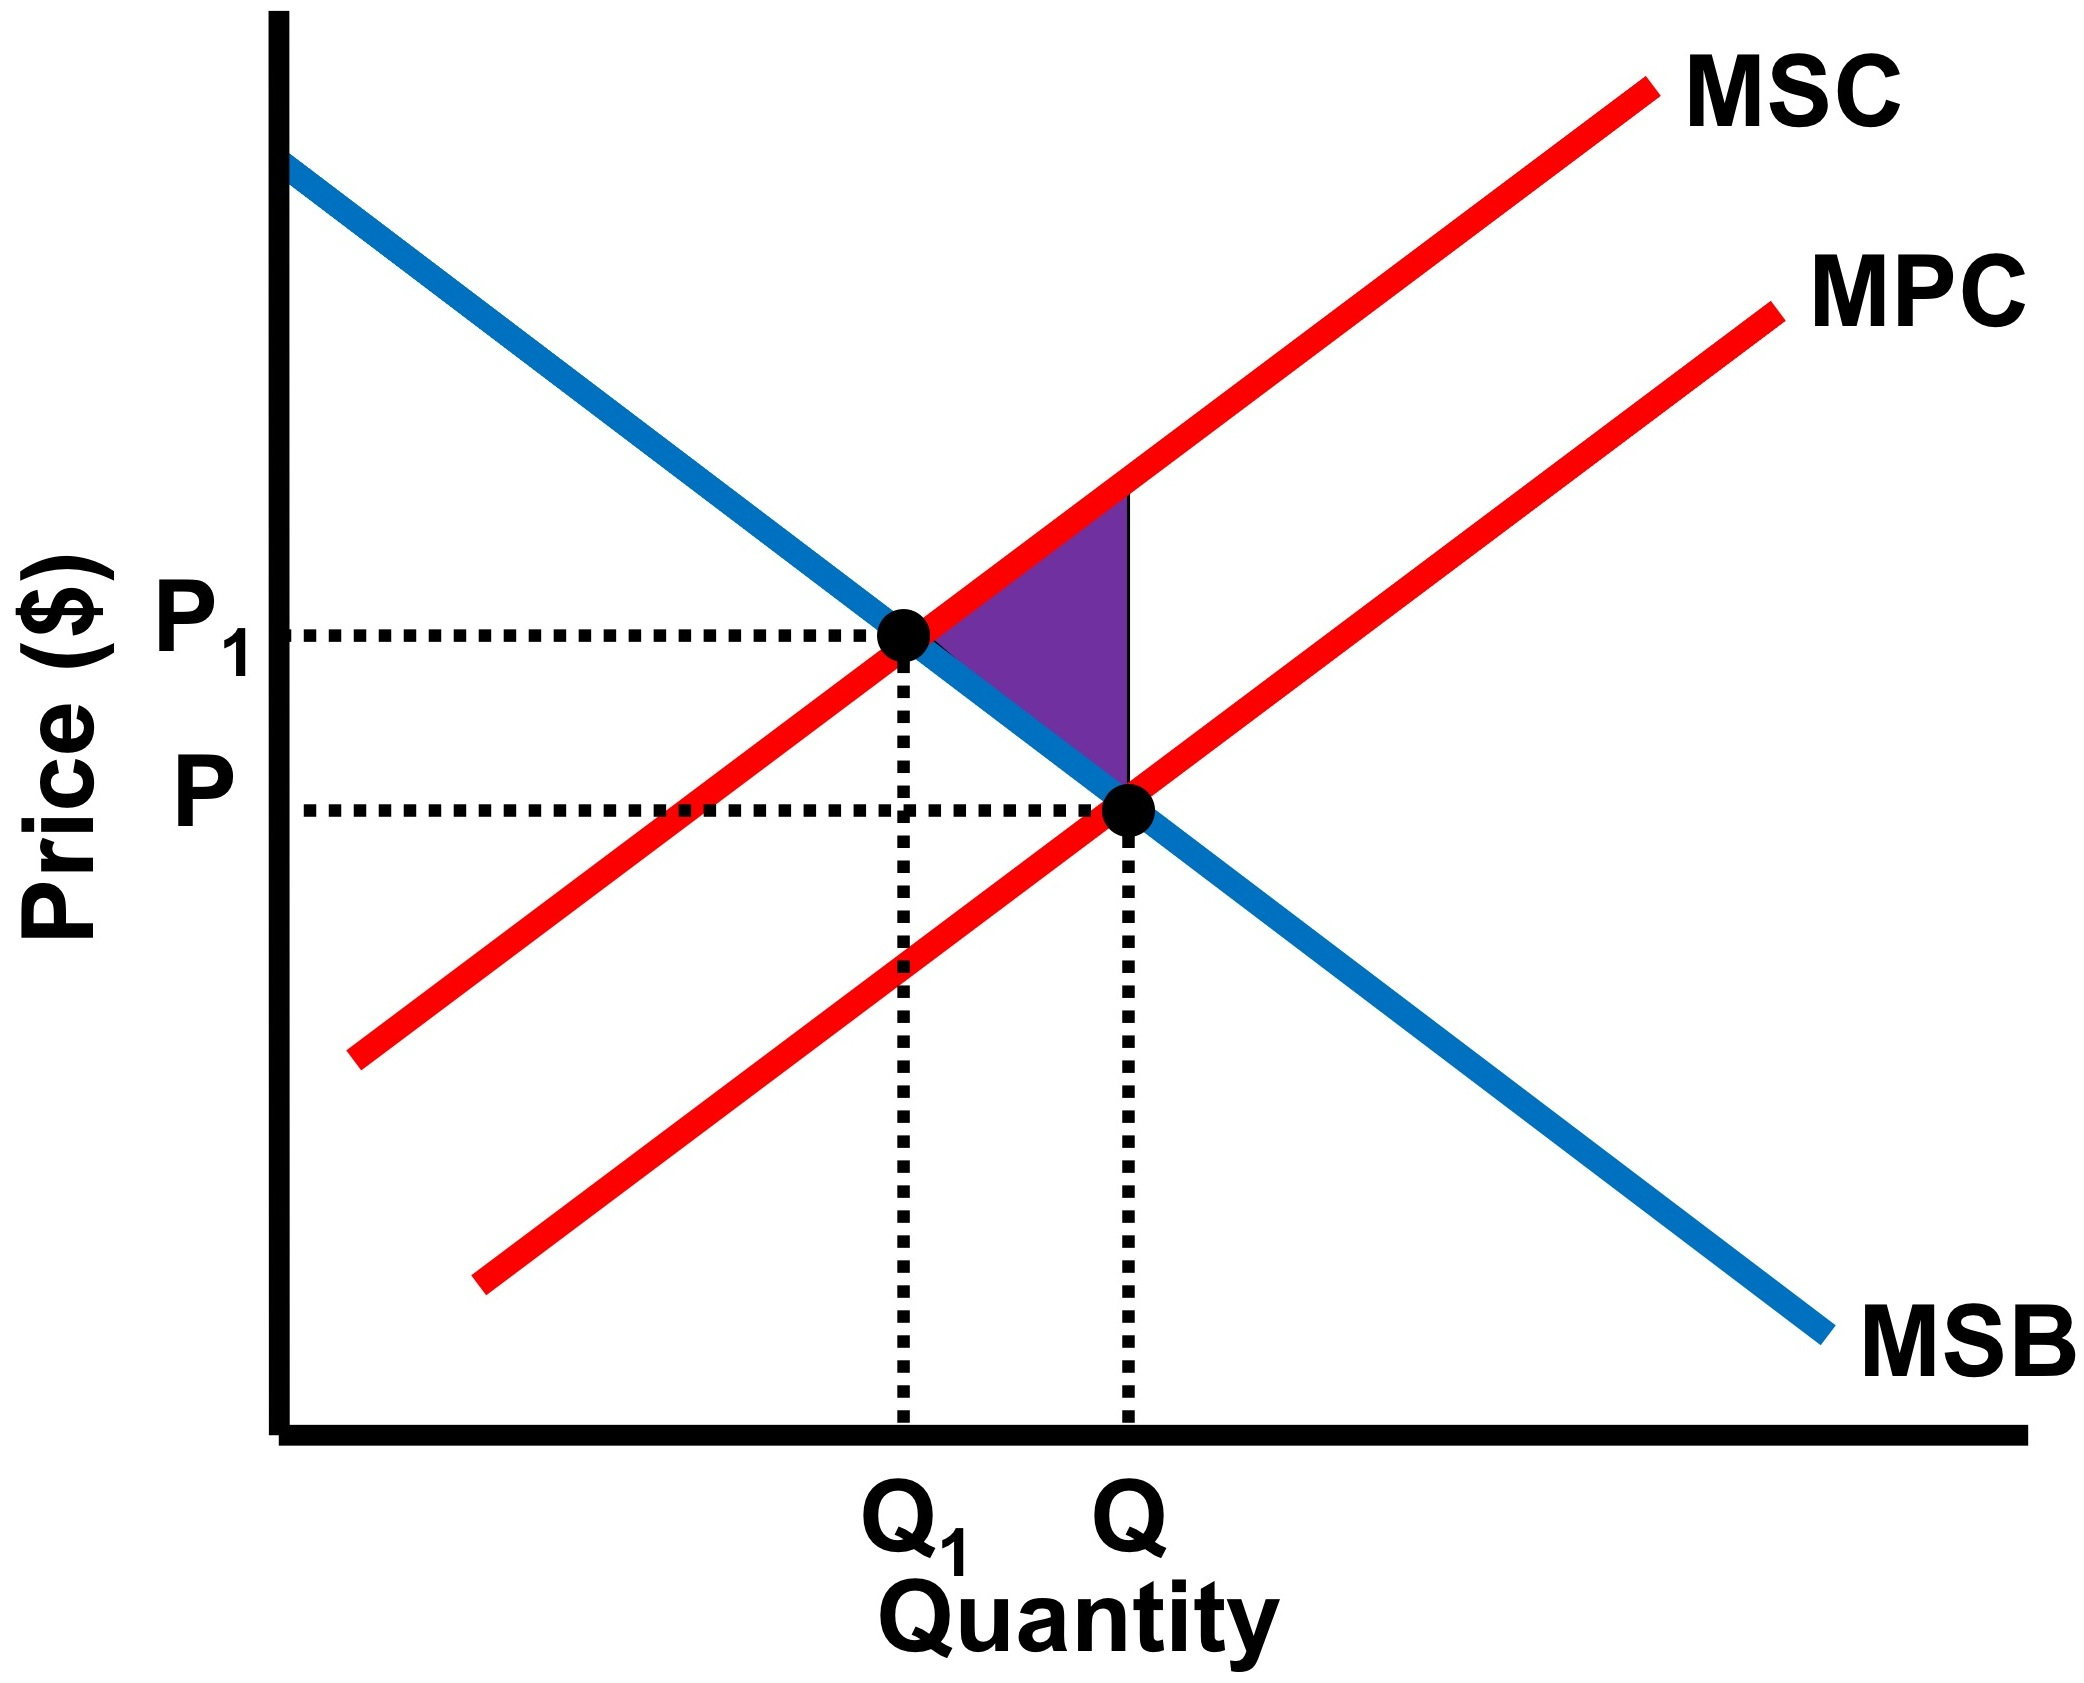
Based on the graph, we can see that MSC shifts the MSB to Q1, which indicates that marginal costs will be more than marginal benefits.
This leads to a loss in quantity where the optimal production level is lost
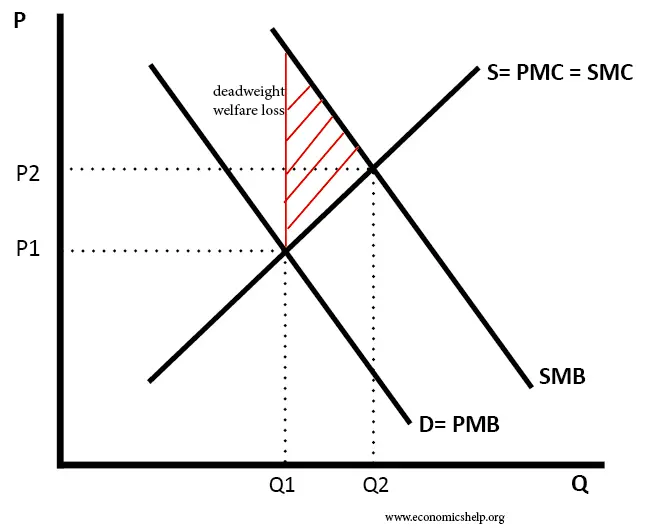
Positive Externalities
A market with Positive externalities occurs when benefit travels to a third party. Subsidized goods and benefits will lead to a positive externalities which creates spillover benefits
Education is an example of positive externalities, therefore, if the market were left alone, it will have a greater marginal social benefit than marginal private benefit at the market quantity of production.
The Marginal external benefit received by society in MSB and MPB is different, as the quantity produced in the MSB is greater. This implies that there is underproduction in the market
As firms try to properly allocate resources, they are giving a per-unit subsidy to producers to equal to the MEB. Per-unit subsidy is a government payment for production of each unit of a product and gives a greater incentive for firms to increase production than a lump-sum subsidy, which is not dependent on production quantity
Negative Externalities
When a market experiences a negative externality, it tends to be producing more a good than is socially desirable. A spillover benefit occurs here to individuals who are neither consumers nor producers of a product yet are responsible for costs.
The Marginal external cost (MEC) is different between MPC and MSC as the cost is imposed on society by the negative externalities. The quantity produced when MSC is greater than MPC by the market, which implies that there is overproduction in the market.
Overproduction can be represented on the graph by the difference between Q2 and Q1
The ideal market position would be MSB = MSC
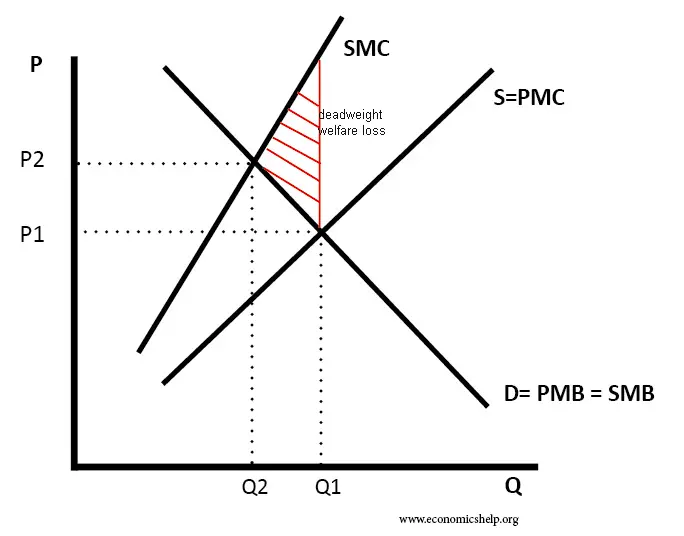
The government can intervene and fix this market failure by issuing a per-unit tax, which is equal to the marginal external cost on producers, with the intention to decrease the amount produced by increasing the costs of production.
This tax aims to decrease the firm’s supply, which shifts the curve to the efficient equilibrium of MSB = MSC
Negative Externalities: NES | Positive Externalities: PED |
|---|---|
N - Negative | P - Positive |
E - Externality | E - Externality |
S - Supply (two supply curves, labeled MPC and MSC) | D - Demand (two demand curves, MPB, MSB) |
According to some economists, they believe that efficient outcomes can. be reached without the intervention of government
Public vs. Private Goods
Private good: are goods which have rivals in consumption and have exclusion. When you purchase something, it will not be available for someone else.
Public good: goods which are non-exclusive and non-rivals. When you consume a good, it does not exclude someone else from enjoying it as well.
Public goods create the issue of the free-rider problem. This issue is specific to public goods as they are nonexclusive, and anyone can benefit from them without paying for them.
Due to this, private firms will not supply public goods. If society wants a public good to be produced, the direct government will have to do it. As a result, the government will then opt to make individuals pay taxes for public goods.
Distribution of Income
There is no doubt that most (if not all) economies experience inequality in income distribution. There are many reasons for this inequality, some of which include:
Demand for highly skilled labor, global competition, past discrimination, education levels, and differences in ability and motivation
The graph for income inequality is called Lorenz Curve
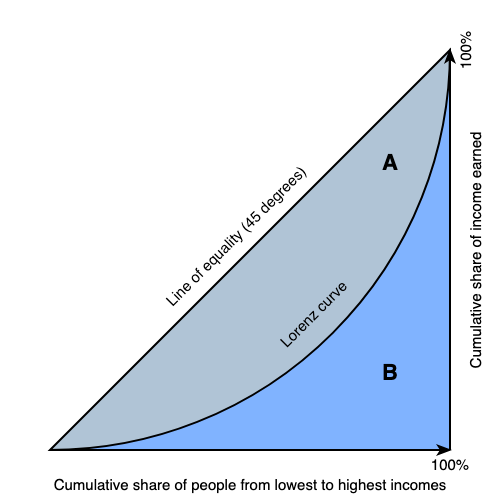
This graph conveys the total income earned by the number of households. The line of perfect equality in the economy is 45 degrees, as indicated. However, the inequality is conveyed by a banana shaped curve.
The bigger the gap between the lorenz curve and the perfect equality line, the bigger the amount of income inequality. The more curved the lorenz curve gets, the more inequality is present in the economy.
A Gini coefficient closer to 0 would mean that there is less income inequality, while a number closer to 1 would mean more inequality
The gini coefficient can be used to calculate inequality. It ranges from 0 to 1, where 1 conveys the income going to one family, while 0 represents all the families receiving the same amount of income.
Types of Taxes
Taxation is a form of government intervention which is set by the government to reduce income inequality. Some taxes tend to improve inequality, while others make it worse. Here are the types of tax:
Progressive tax: results in higher tax rates as income increases. The US federal income tax is an example.
Every certain amount of money earned as income must be taxed. Depending on the income, higher income levels are taxed at higher rates. Progressive tax is able to decrease inequality.
Proportional Tax: applies the same tax on everyone regardless of their income. the same percentage total income in tax will be paid by all individuals.
Regressive Tax: the average tax burden decreases as percent of income rises.
Sales tax of goods and services is an example. People who earn a higher income are more likely to save some of their income, while lower income people are less likely to save their money. A portion of sales tax tends to be a greater burden on low income earners, which is what makes this tax regressive.