
Ch 16 - Aggregate Supply and Aggregate Demand
(Macroeconomics)
Business Cycles
Business cycle: is the pattern experienced by the economy. They are intervals of expansion followed by recession. These expansions and contractions experienced by the economy are called economic fluctuations, and are represented by the business cycle.
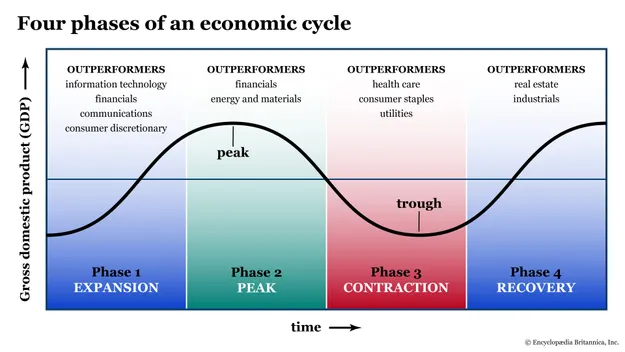
In reality, economic activities do not have a uniform schedule, as they can vary depending on the severity of the situation, which makes then hard to predict
NOTE: as an AP student, you must be able to explain why the economy moves in this cycle. The AS/AD model will help to analyse macroeconomic functions.
The AS/AD model displays the question which determine output, income, employment, and prices in the economy.
Contraction: a sustained decline in economic activity
Expansion: A sustained improvement in economic activity
Peak: end of expansion and the beginning of contraction
Trough: the end of contraction and the beginning of expansion
Long-Run Aggregate Supply
Aggregate Supply: is the amount of all goods and services brought to market by all producers. This is the supply of everything by everyone.
Aggregate supply is measured by dollars instead of value
Long-Run Aggregate Supply: aggregate supply after wages and other resource prices have adjusted to macroeconomic conditions
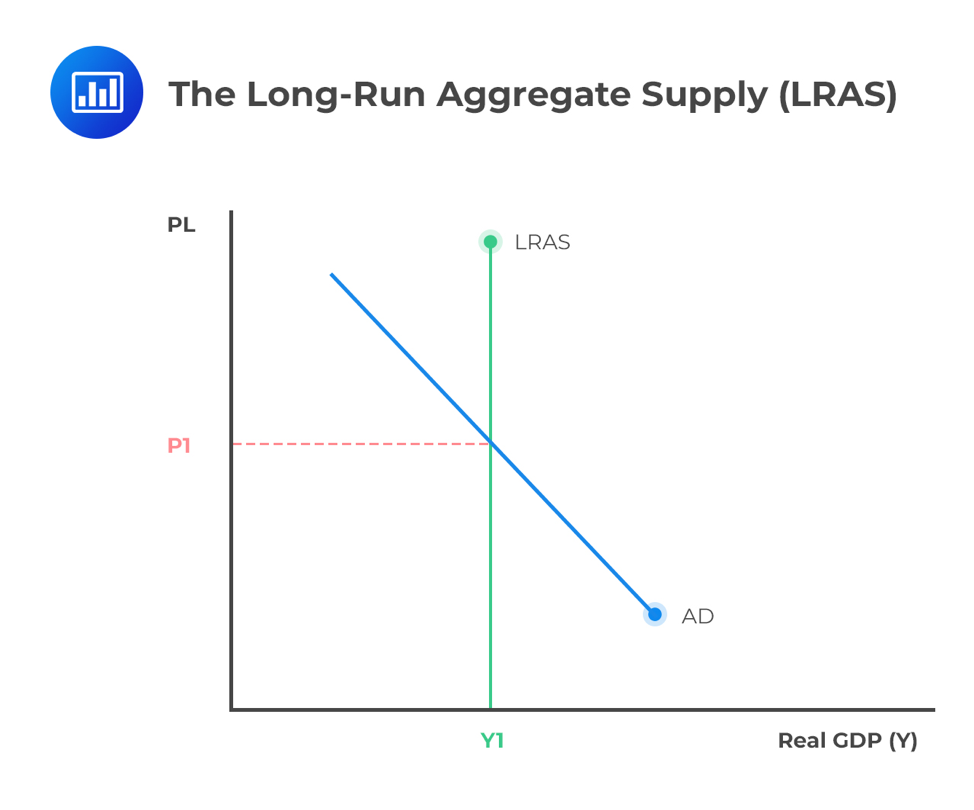
The price shifts from P1 to a point above, labelled P2. The price level will be higher at P2 however the amount of goods supplied by producers will stay constant at Y1. The only changes experienced here are in resources or technology, which affect the long-run aggregate supply.
LRAS is vertical due to the amount supplied in the long run which does not depend on the price level.
An increase in resources or technological advances shifts LRAS to the right, while a reduction in resources or a decline in technological productivity shifts LRAS to the left.
Two shifters of LRAS: Technological advances and increase/decrease in resources.
Short-Run Aggregate Supply
Factors affecting SRAS: 1- Change in price level, 2- change in the expected future price level, 3- a change in the price of land, labor, or capital
Short-run Aggregate Supply: aggregate supply before wages and other resource prices have adjusted to macroeconomic conditions.
Suppliers could get higher prices for their products, but their input costs have risen proportionally. Aggregate supply would be unaffected if the costs of production rose in tande, with the price level.
In the long run, a change in price level is matched by a change in input costs.
In the short run, aggregate supply is unaffected as a change in price level is not matched by a change in input costs. A rise in price level leads to an increase in aggregate supply.
As price level rises from P1 to P2, the amount supplied by all producers increases from Y1 to Y2. Suppliers are getting higher prices for their products but resource price have not yet increased. As a result, SRAS slopes upward.
If prices are expected to increase, the suppliers will bring less to markets. Producers would wait will the prices rise, then bring their products to market.
The SRAS will decrease as a result of this. The LRAS remains unchanged as the two shifters (Technology & resources) have not been changed.
The relationship between the expected future price level and aggregate supply is downward sloping on the graph. A downward sloping line indicates a negative or inverse relationship. When expected future prices increase, aggregate supply decreased an when expected future prices decrease, aggregate supply increase.
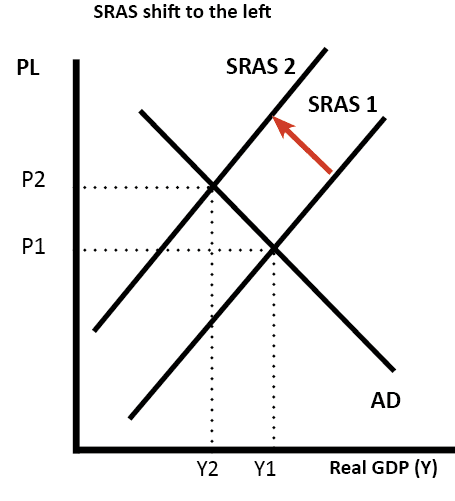
The SRAS shifting to the left signifies that producers will bring less to the market as their future prices are expected to be higher. If the factor listed on the vertical axis changes, then there is movement from one point to another along the line. The line shifts right or left when the factor causing the change is not listen on the vertical axis.
If prices of land, labour, or capital increase, the SRAS will decrease and the curve will shift to the left.
This happens as suppliers have an incentive to cut back production when costs increase.
Long-Run Aggregate Supply:
Why is it vertical? | The amount supplied in the long run is not affected by the prices of final goods and services in the economy |
|---|---|
What can shift it? | - A change in the amount of resources in the economy- Changes in production technology |
Short-Run Aggregate Supply:
Why is it upward sloping? | Suppliers have incentive to bring more to market if the price level rises because they can get more for their products while wages remain unchanged |
|---|---|
What can shift it? | - A change in the amount of resources in the economy- Changes in production technology- Changes in expected future prices- Changes in the prices of land, labour, or capital |
Aggregate Demand
Aggregate demand: is the amount of goods and services demanded by households, businesses, governments, and foreigners. This is the demand for all final goods and services by everyone.
Aggregate demand is affected by many factors, however, it can all be categorized in groups.
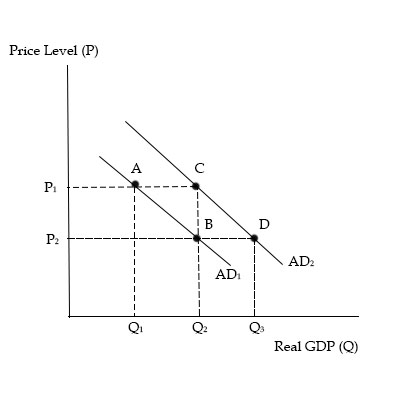
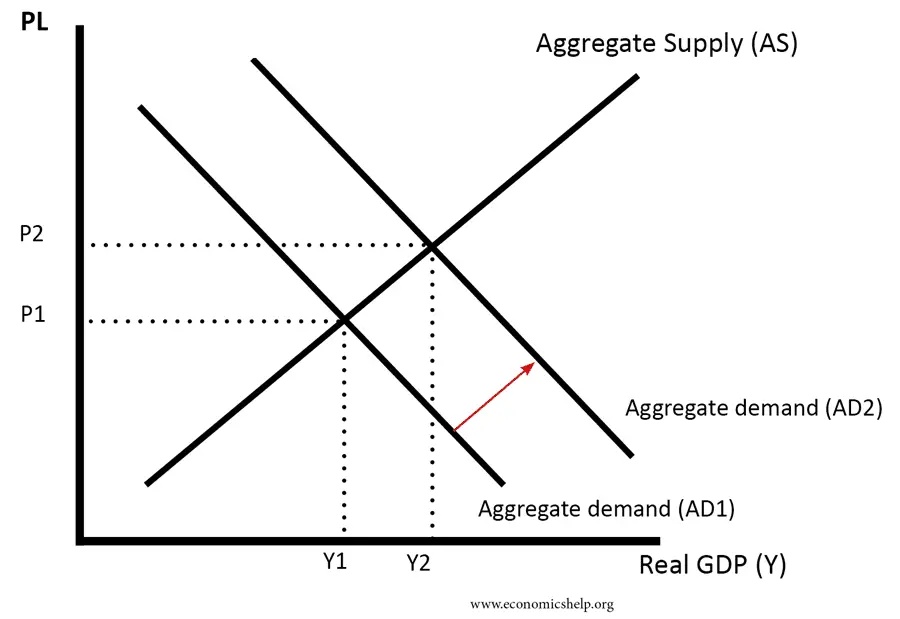
As seen on the graph, as the price level increases (P1 to P2), the dollar amount of aggregate demand decreases (Q3 to Q2, then Q1). In AD1, there is movement up the aggregate demand curve from B to A, and an AD2, the movement up the aggregate demand curve is from D to C.
Why does this happen?
When prices increase generally there is inflation and it does not destroy income in the economy. When price level rises, most people and firms earn more income. Profits increase for some firms and this transfers to firm owners who live in households.
Foreign Purchaser effect: When price level rises, on reason aggregate demand declines is due to foreign demand decreasing.
These are foreigners who do not experience an increase in prices and income. They demand less since our goods have increased in price relative to theirs.
The wealth effect: When households begin to spend more and gain less, this decreases aggregate demand.
Following inflation, the money which households saved will not have the same value, meaning that if a household saved 1$ million for retirement, it would not last them as they previously thought.
Using the aggregate demand curve, we can see that it is downward sloping and the price level and total demand vary inversely. When price level rises, aggregate demand decreases and vise versa. → this is able to happen as foreign purchases effect and wealth effect are set into motion.
Consumer Confidence: is a statistical measure of consumers’ feelings about current and future economic problems, and is used as indicator of the overall state of the economy.
The AD curve shifts to the right due to the fact that prices remain unchanged while aggregate demand increases. This shift occurs as there is more demand in the economy as consumers have more confidence in the economic prospects.
Summary of Aggregate Demand:
Why is it downward sloping? | 1. Foreign purchases effect: foreigners demand less when domestic prices rise because their income have not risen in tandem, and domestic consumers prefer more imports since domestic prices are up2. Wealth effect: financial wealth is destroyed when prices rise, this causes consumers to save more and spend less |
|---|---|
What can shift it? | - Changes in consumer confidence- Changes in taxes- Changes in business confidence- Changes in money supply- Changes in foreign demand due to preferences or income- Changes in government spending |
Changes in tax: A reduction in income tax gives households more after-tax income
Changes in money supply: lowers interest rates and stimulates firms to borrow and spend more on plant and equipment.
An increase in government spending shifts the AD curve to the right
Equilibrium
At a point of excess supply due to increase in price level, producers will notice their inventory of finished goods piling up. This inventory accumulation induces suppliers to lower their prices. Excess supply will shrink but not disappear until the price level falls.
If price level is below the equilibrium price level, there will be a shortage of goods and services.
Higher prices will reduce excess demand, but will not disappear completely until the price level increases.
Equilibrium Price Level: The price level that equates aggregate supply and aggregate demand; the average level of prices in the economy
Equilibrium Quantity: the amount of output that results in no shortage or surplus; the amount of goods and services bought and sold in the economy
If a nation experiences a decline in the foreign demand for products, it means that they are facing a recession. The AD curve would shift to the left.
The reduction of foreign demand shifts the AD to the left, and creates a new equilibrium point. This decline causes the price level and real GDP to fall.
Decline in GDP means:
Production in the economy is lower
income in the economy is lower because whenever anything is produced it generates an equal amount of income
unemployment since less production means less demand for labor.
Stagflation: is consistent high inflation paired with high unemployment and stagnant demand in a country’s economy. It is inflation combined with high prices, and can only be caused by sras shifting to the left.
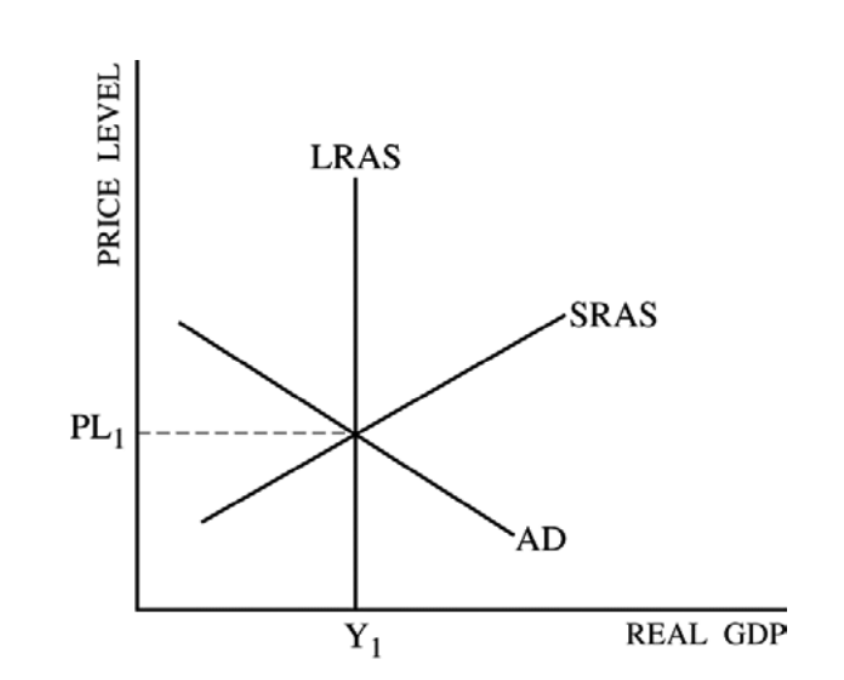
In fig. 7, we can see the optimal economy where all three curves intersect at the point of equilibrium. Here. the Long run aggregate supply curve is operating at full employment. In economic terms, we can say that it is perfectly on the production possibilities frontier (maximum efficiency)
In the long run, the economy returns to full-unemployment equilibrium
We have witnessed a full business cycle, a tax led to recession, but resources fell and SRAS shifted to the right. The rightward shift was the expansion as output increases
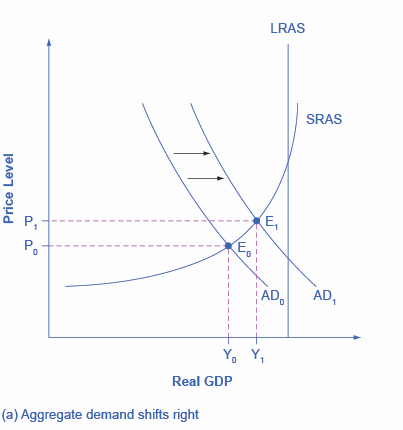
Before the economy aims to remedy recession, we must begin at full-employment and assume that there is an increase in business confidence. This shifts the AD curve to the right.
With more employment and resources strained beyond their potential, wages and resource prices rise. Firms should firms mut increases wages to encourage workers to leave their current positions.
When wages and other resource prices rise, SRAS shifts to the left.
Supply shock: an unexpected change in short-run or long-run aggregate supply
Economic Growth
Economic growth: is an increase in the production of goods and services in an economy.
Increases in technology, labor, human capital, and capital goods all aid in economic growth. These are able to shift short and long-run aggregate supply to the right.
Whatever shifts LRAS, also shifts SRAS. If the economy obtains more resources or better technology, then full-capacity output increases.
Increasing human capital: when labor becomes better triand and more effective