A&A SL Core Textbook Chapter 12 Lessons A-J
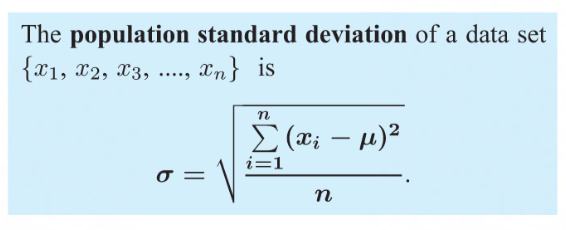
Standard Deviation
a form to more accurately represent the spread of data
the square root of the variance
measures the degree to which the data deviates from the mean
a non-resistant measure of spread
only useful if the data is symmetrical
if a sample from a large population the sample standard deviation (s) is a more accurate estimate
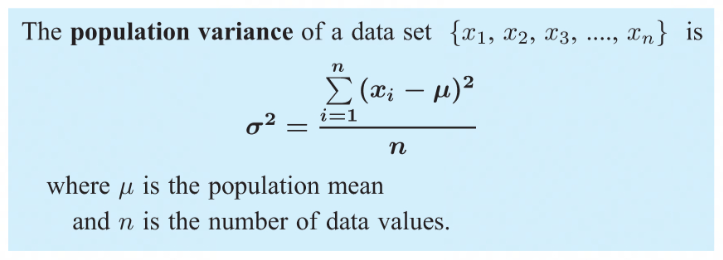
Variance
represents a more accurate spread of data
the average of the squares of the distances from the mean
If data values (xᵢ) are situated close around the mean (μ) then (xᵢ - μ)² would be too small and have too small of a variance
Percentiles
the values below which a certian percentage of the data lies
Q1 is the 25th percentile
Q2 is the 50th percentile
Q3 is the 75th percentile
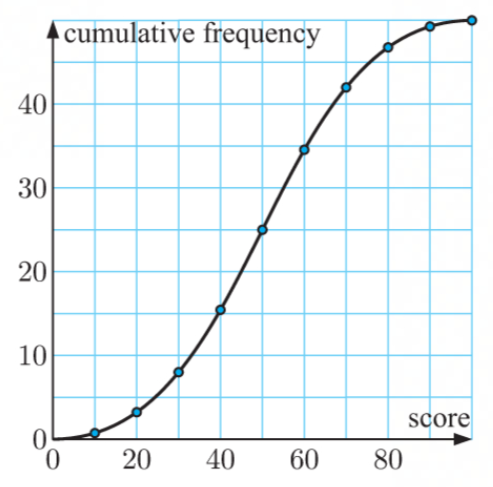
Frequency Graph
made of the cumulative frequency
a smooth graph with curves
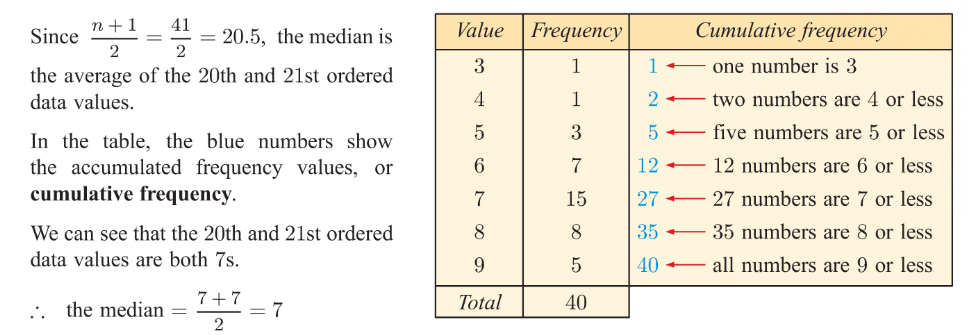
Cumulative Frequency
shows the number/proportion of numbers that lie above or below a particular value
can create column for the cumulative frequency within a frequency table
will create a frequency graph which create a graph of smooth curves
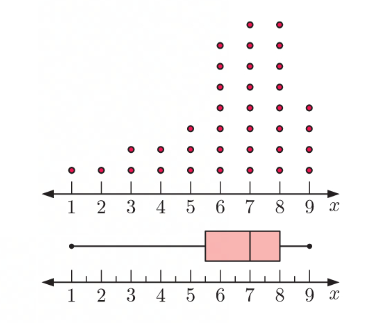
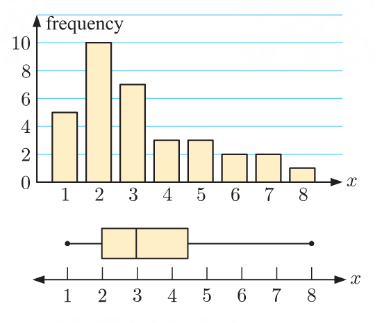
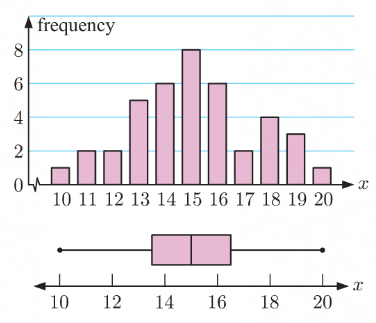
parallel box and whisker diagram / parallel box plot
a visual comparison of the distribution of two data sets
used to easily compare statistics such as the median, range, and IQR
Outliers
extraordinary data separated from the main body of data
applies to any value larger or smaller than the boundaries
upper boundary = upper quartile + 1.5 x IQR
lower boundary = upper quartile + 1.5 x IQR
outliers are marked with an Astrid on a Wisker box plot
it is possible to have more than one outlier
negatively skewed box plot
positively skewed box plot
symmetrically distributed box plot
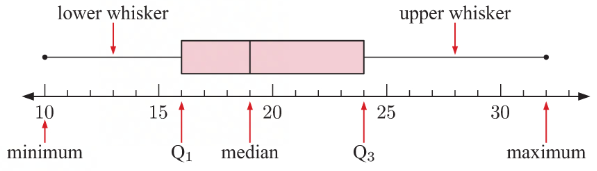
Five Number Summary
made up of:
the minimum value
the lower quartile Q1
the median Q2
the upper quartile Q3
the maximum value
Box and Whisker diagram / Box Plot
will show the five number summary of the data set
rectangular box represents the “middle“ half
lower whisker shows the 25% smallest values
upper whisker shows the 25% largest values
shows the systematic distribution of a box plot
Interquartile range
AKA: IQR
the median divides the ordered set into halves and then in half again by quartiles
IQR = Q3 - Q1
Lower Quartile (Q1)
middle value of the lower half
Upper Quartile (Q3)
middle value of the upper half
Interquartile range (IQR) (Q2)
the range of the middle half of data
The Range
the difference between the maximum data value and the minimum data value
Range = maximum - minimum
not particularly reliable as it only uses two data values
easily influenced by extreme values and outliers
useful for choosing class intervals
approximation
calculated mean represents the approximated value
reason to why you need to know each individual data value
a result of assuming data values within classes
midpoint / mid-interval value
a representation of all data values in a class interval
finding the median
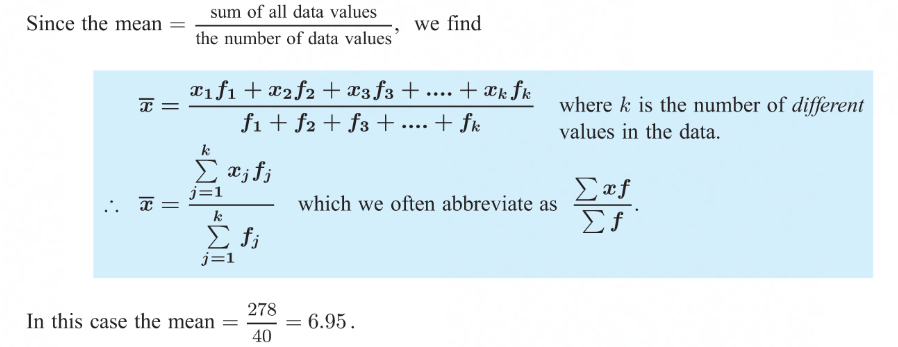
solving for the mean
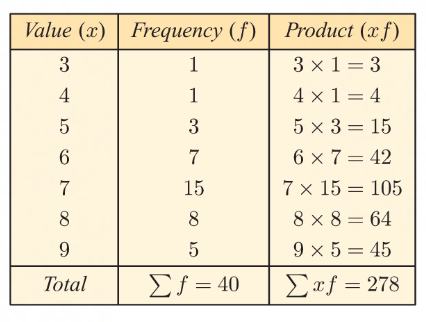
product column
helps to add the data values
frequency column
found in a frequency table
used to easily find the mode
median characteristics
gives data a halfway point
only accounts for middle values
not affected by extreme values
mean characteristics
commonly used and easy to understand
accounts for all values
affected by extreme values
mode characteristics
gives the most usual value
only accounts for common values
unaffected by extreme values
bimodal
when a data set has two values that occur most frequently
center of the data
measured with the mean, median, and mode
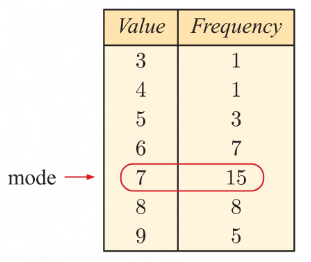
mode
most frequently occurring value in a discrete data set
the modal class in continuous data sets
if a data set has two values that both occur most frequently it is bimodal
if the data set has three or more most frequently occurring values the mode becomes inapplicable
median
middle value of an ordered data set
splits data in half
EX: the median mark for a test is 73% then you know that half the class scored less than or equal to 73% and half the class scored greater than or equal to 73%
if there is an odd number of data values the median is one of the original values
if there is an even number of data values then the median will be the average of the two middle numbers
if there are n data values listed in order from smallest to largest the median is the (n+1/2)th data value
mean
the statistical name for an arithmetic average
mean = the sum of all data values / the number of data values
use ˉx to represent the mean of a sample
use μ to represent the mean of a population
you do not always have data from all the population members so the exact value of μ is unknown
collect data from a sample of a population and use the mean of the sample ˉx as an approximation for μ