Tags & Description
Variable
A characteristic or attribute that can assume different values.
Population
Consists of all subjects ( human or otherwise) that are being studied.
Sample
A group of subjects selected from a population
Descriptive Statistics
consists of the collection, organization, summarization, and presentation of data.
Inferential statistics
Consists of generalizing from samples to populations, performing estimations and hypothesis tests, determining relationships among variables, and making predictions.
Probability
The chance of an event occuring
hypothesis testing
decision-making process for evaluating claims about a population, based on information obtained from samples.
Qualitative variables
variables that have distinct categories according to some characteristic or attribute (nominal, ordinal)
Quantitative Variables
variables that can be counted or measured (ration, interval)
Discrete variables
Countable, whole numbers, and assume values that can be counted.
measured in whole units/digits
Continuous Variables
can assume an infinite number of values between any two specific values. They are obtained by measuring. They often include fractions and decimals can be measured in decimals
Nominal level of measurement
classifies data into mutually exclusive (nonover-lapping) categories in which no order or ranking can be imposed on the data. e.g. married/unmarried; alive/dead; yes/no
Ordinal level of measurement
classifies data into categories that can be ranked; however, precise differences between the ranks do not exist. e.g. language proficiency
Interval level of measurement
ranks data, and precise differences between units of measure do exist; however, there is no meaningful zero. e.g. age
Ratio level of measurement
possesses all the characteristics of interval measurement, and there exists a true zero. In addition, true ratios exist when the same variable is measured on two different members of the population. e.g. temperature
Four levels of measurement
Nominal
Ordinal
Interval
Ratio
(Simple) Random Sample
sample in which all members of the population have an equal chance of being selected
each sample of a fixed size is equally likely to be drawn from the collection of all possible random samples of the given size.
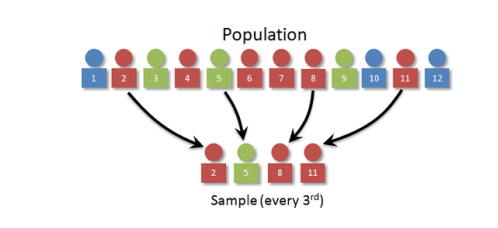
Systematic sample
a sample obtained by selecting every …th member of the population.
Randomly select a starting point (that is, a population unit) and then take every …th population unit after that.
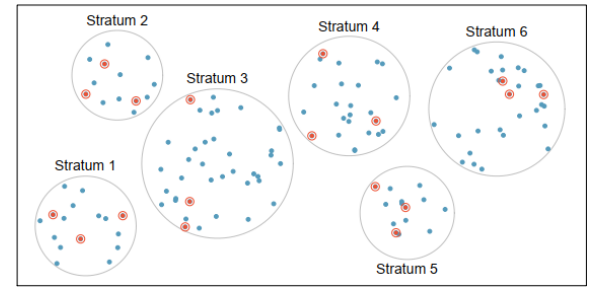
Stratified sample
a sample obtained by dividing the population into subgroups or strata according to some characteristic relevant to the study. (There can be several subgroups.) Then subjects are selected at random from each subgroup.
Divide the population into mutually disjoint (non-overlapping) groups or sub-populations called strata (singular form: stratum) and then take an SRS from each stratum.
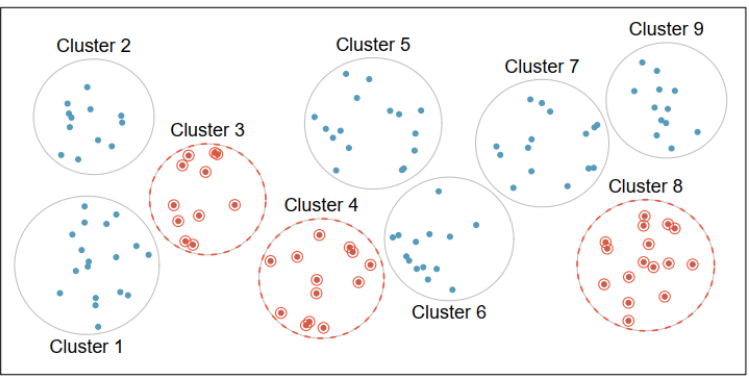
Cluster sample
obtained by dividing the population into sections or clusters and then selecting one or more clusters at random and using all members in the cluster(s) as the members of the sample
Divide the population into mutually disjoint (non-overlapping) clusters (that is, groups/sub-populations), where individual clusters mirror the diversity of the entire population, while the set of clusters are similar to each other. Then randomly select some of the clusters, and all the members belonging to these chosen clusters will constitute the cluster random sample.
Sampling error
the difference between the results obtained from a sample and the results obtained from the population from which the sample was selected.
The actual process of sampling causes sampling errors. It is the error caused by observing a sample only instead of enumerating the entire population. A sample will never be exactly representative of the population so there will always be some sampling error. As a rule, the larger the sample, the smaller will be the error.
nonsampling error
occurs when the data are obtained erroneously or the sample is biased, i.e., nonrepresentative.
Observational study
the researcher merely observes what is happening or what has happened in the past and tries to draw conclusions based on these observations
Experimental Study
the researcher manipulates one of the variables and tries to determine how the manipulation influences other variables.
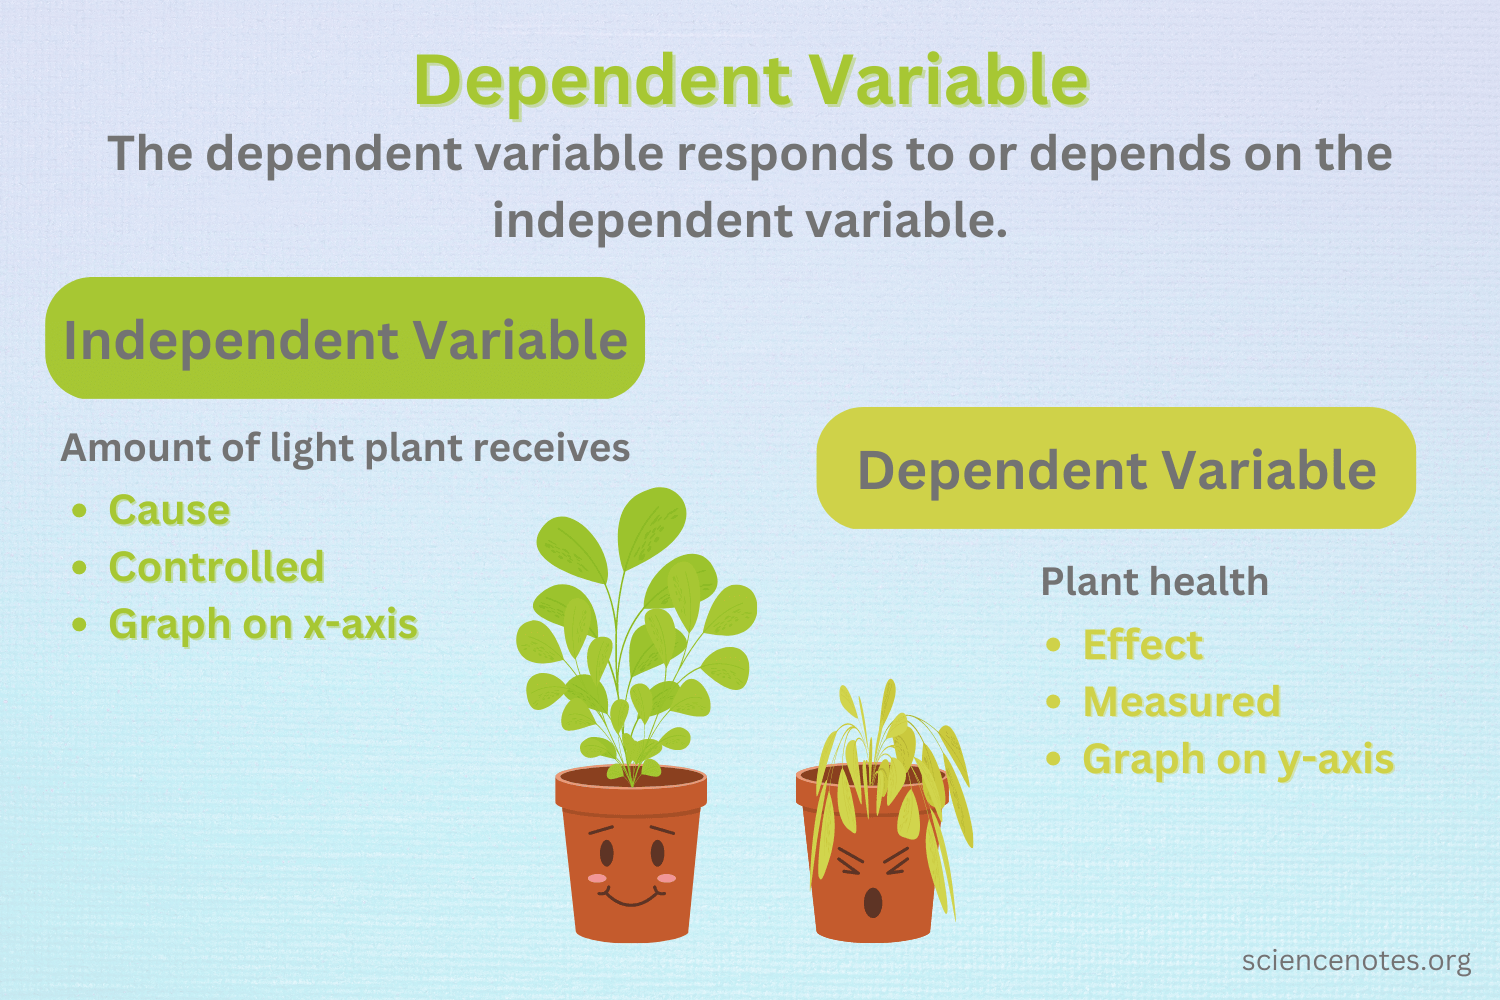
Independent variable
in an experimental study is the one that is being manipulated by the researcher. Also called the explanatory variable.
Dependent variable
Resultant or outcome variable
Treatment group
The group that received special instruction
Control group
The group that does not receive special instruction.
Often given a placebo —a (fake) treatment that cannot influence the response variable.
Lurking Variable
A variable or factor that has an important effect on the relationship among the variables in a study but is not one of the explanatory variables studied.
Extraneous factors which can potentially influence the effect of the explanatory variable(s) on the outcome of the response variable
Confounding variable
Two variables are confounded when their effects on a response variable cannot be distinguished from each other. The confounded variables may be either explanatory variables, or lurking variables, or both.
Some common Non-sampling Errors
Non-response Bias
Self-funded or self-interest studies
Misleading use of data
Sampling Bias
Convenience sampling
Voluntary Response/Self-selected samples
Non-sampling errors
Caused by external factors not related to the sampling process:
Coverage error (under coverage, over coverage),
Defective measurement device,
Processing error (data entry error, coding error, editing error)
poor questionnaire design,
Interviewer bias, biased decision making
Non-response bias
self-selection bias and
respondent errors, etc.
Statistical Inference
Usually, a statistic is used to draw meaningful scientific conclusions or decisions (or, inference) about an unknown parameter. This process of drawing inference about an unknown population or a population parameter is called ______ _______
Categorical data
nominal or ordinal
Quantitative data
ration or interval
Validity
How accurate is the measure/research
Reliability
How consistent is the measure
Measurement error
Measurement Error (also called Observational Error) is the difference between a measured quantity and its true value. It includes random error (naturally occurring errors that are to be expected with any experiment) and systematic error (caused by a mis-calibrated instrument that affects all measurements)
Random error
Random error (also called unsystematic error, system noise or random variation) has no pattern. One minute your readings might be too small. The next they might be too large. You can’t predict random error and these errors are usually unavoidable.
Systematic error
Systematic error (also called systematic bias) is consistent, repeatable error associated with faulty equipment or a flawed experiment design.
Central tendency
Central tendency (sometimes called measure of location, central location, or just center), attempts to describe an entire set of data with one figure — a statistic such as an average amount or a median price.
Central tendency doesn’t tell you specifics about the individual pieces of data, but it does give you an overall picture of what is going on anthe entire data set. There are three major ways to show central tendency: mean, mode and median.
Mean
The mean is the average of a data set. Influenced by extreme scores (unlike median)
Mode
The mode is the most common number in a data set
Median
The median is the middle of the set of numbers
Dispersion
Dispersion in statistics is a way of describing how spread out a set of data is. Measured by standard deviation, interquartile range, etc.
Variability
Variability (also called spread or dispersion) refers to how spread out a set of data is. Variability gives you a way to describe how much data sets vary and allows you to use statistics to compare your data to other sets of data. The four main ways to describe variability in a data set are:
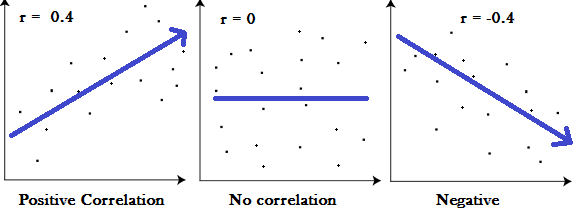
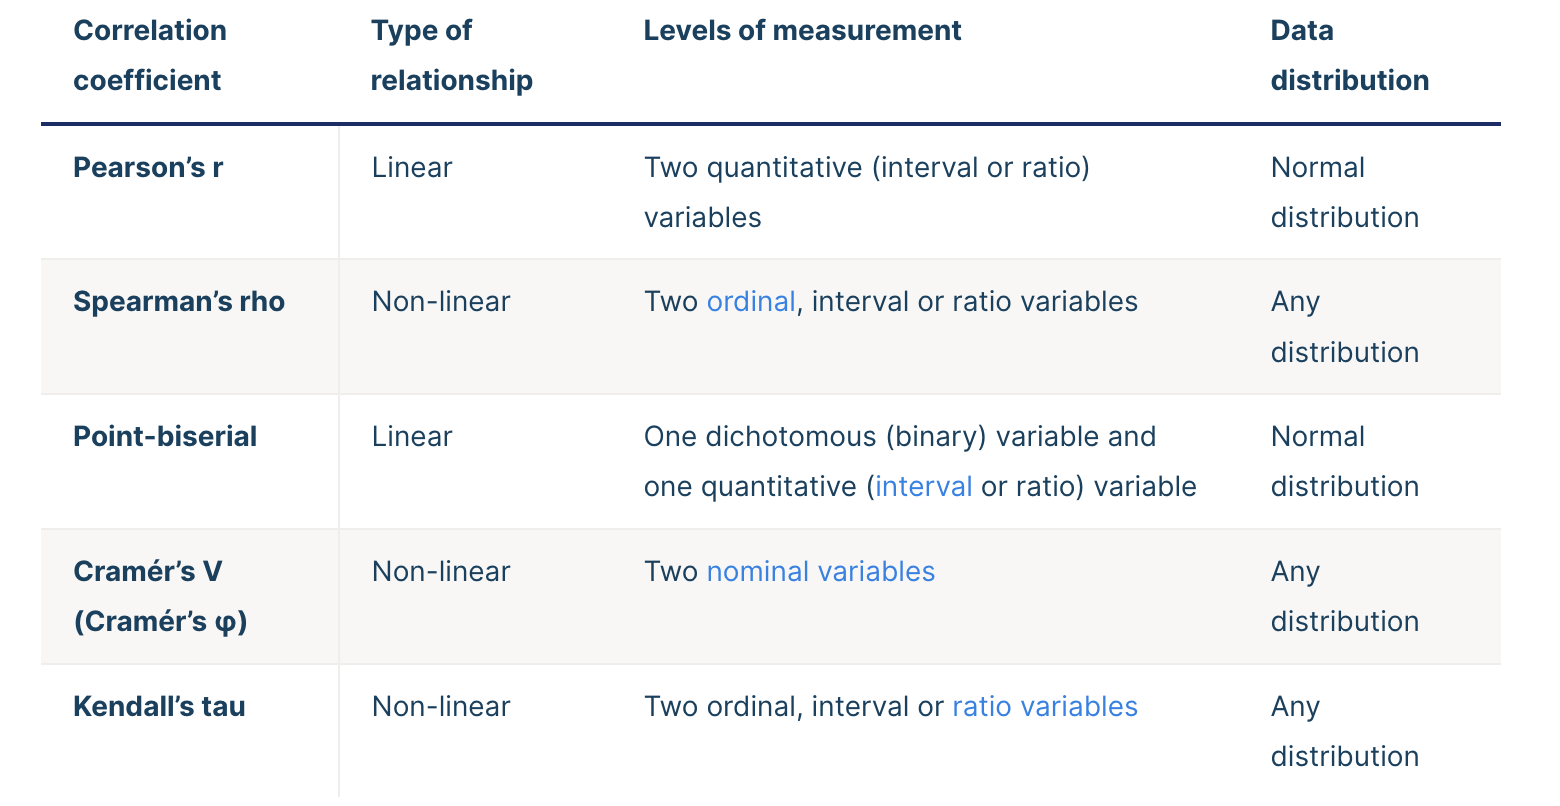
Correlation
Correlation is used to test relationships between quantitative variables or categorical variables. In other words, it’s a measure of how things are related. Tells about the direction and strength of a linear relationship. Expressed in scatterplots which can be positive, negative or show no correlation; and can be between -1 and 1
T-test
The t test tells you how significant the differences between group means are. It lets you know if those differences in means could have happened by chance. The t test is usually used when data sets follow a normal distribution but you don’t know the population variance.
Chi-Square
A chi-square goodness of fit test determines if sample data matches a population.
A chi-square test for independence compares two variables in a contingency table to see if they are related. In a more general sense, it tests to see whether distributions of categorical variables differ from each another.
QQ Plot
Q Q Plots (Quantile-Quantile plots) are plots of two quantiles against each other. A quantile is a fraction where certain values fall below that quantile. For example, the median is a quantile where 50% of the data fall below that point and 50% lie above it. The purpose of Q Q plots is to find out if two sets of data come from the same distribution.
PP Plot
P–P plot is a probability plot for assessing how closely two data sets agree, or for assessing how closely a dataset fits a particular model
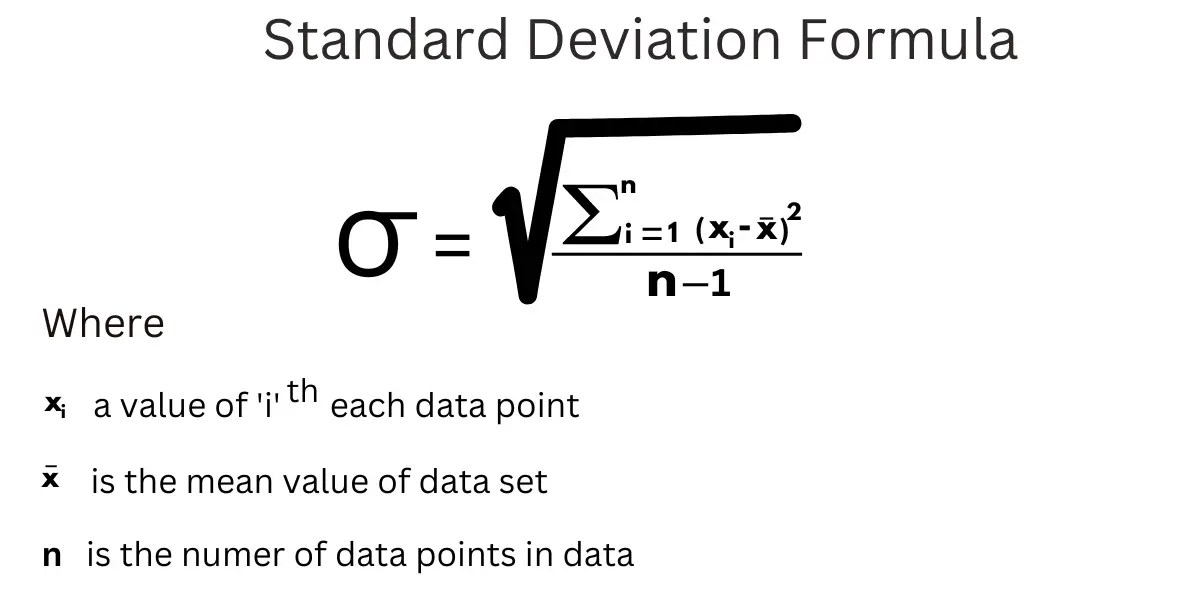
Standard deviation
Standard deviation is a measure of dispersement in statistics. “Dispersement” tells you how much your data is spread out. Specifically, it shows you how much your data is spread out around the mean or average. For example, are all your scores close to the average? Or are lots of scores way above (or way below) the average score?
Small sd indicates that the data points are close to the mean => low dispersion
Large sd indicates that the data points are distant from the mean => high dispersion
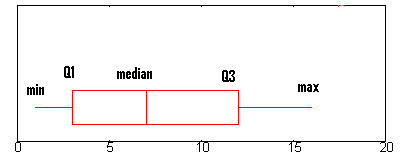
Interquartile range
The interquartile range is a measure of where the “middle fifty” is in a data set. Where a range is a measure of where the beginning and end are in a set, an interquartile range is a measure of where the bulk of the values lie.
Variance
Variance measures how far a data set is spread out. It is mathematically defined as the average of the squared differences from the mean.
Null hypothesis
The null hypothesis, H0 is the commonly accepted fact; it is the opposite of the alternate hypothesis. Researchers work to reject, nullify or disprove the null hypothesis. Researchers come up with an alternate hypothesis, one that they think explains a phenomenon, and then work to reject the null hypothesis.
Coefficient of variation
The coefficient of variation (CV) is a measure of relative variability. It is the ratio of the standard deviation to the mean (average).
The CV is particularly useful when you want to compare results from two different surveys or tests that have different measures or values.
Boxplot
A boxplot, also called a box and whisker plot, is a way to show the spread and centers of a data set. Measures of spread include the interquartile range and the mean of the data set. Measures of center include the mean or average and median (the middle of a data set). Also shows outliers
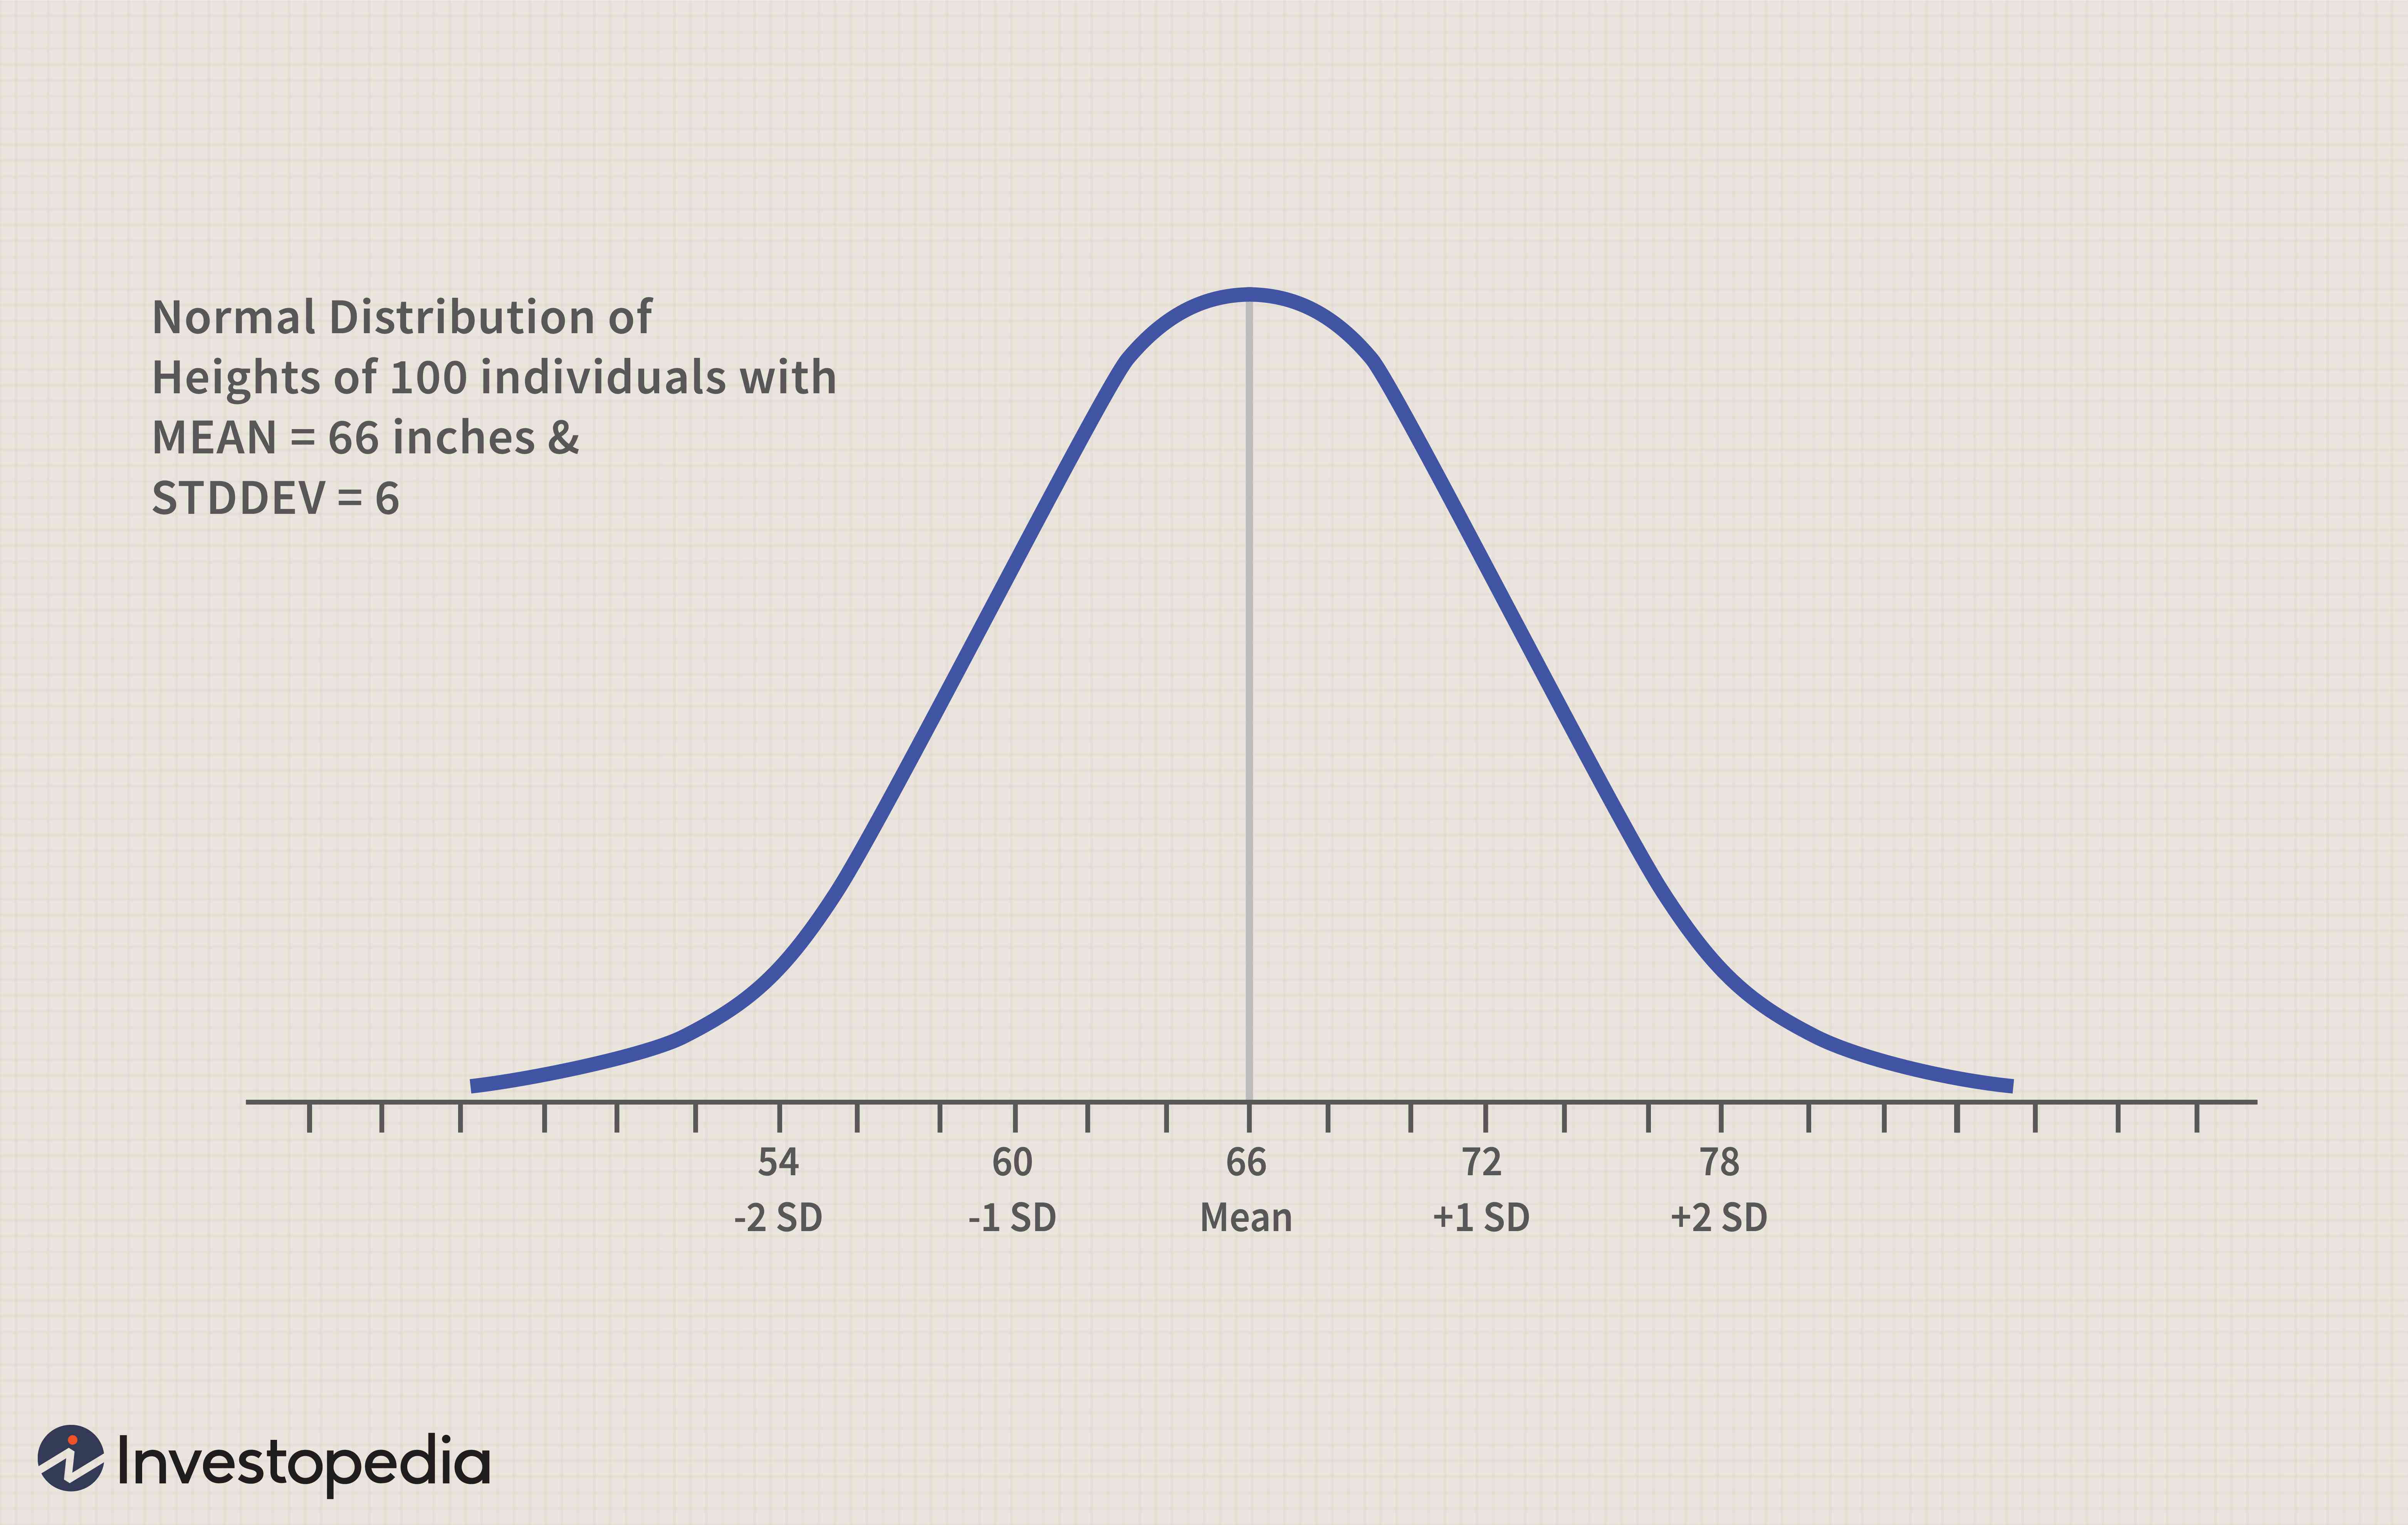
Z-scores
Simply put, a z-score (also called a standard score) gives you an idea of how far from the mean a data point is. But more technically it’s a measure of how many standard deviations below or above the population mean a raw score is.
Normal distribution
Bell-shaped, desirable distribution.
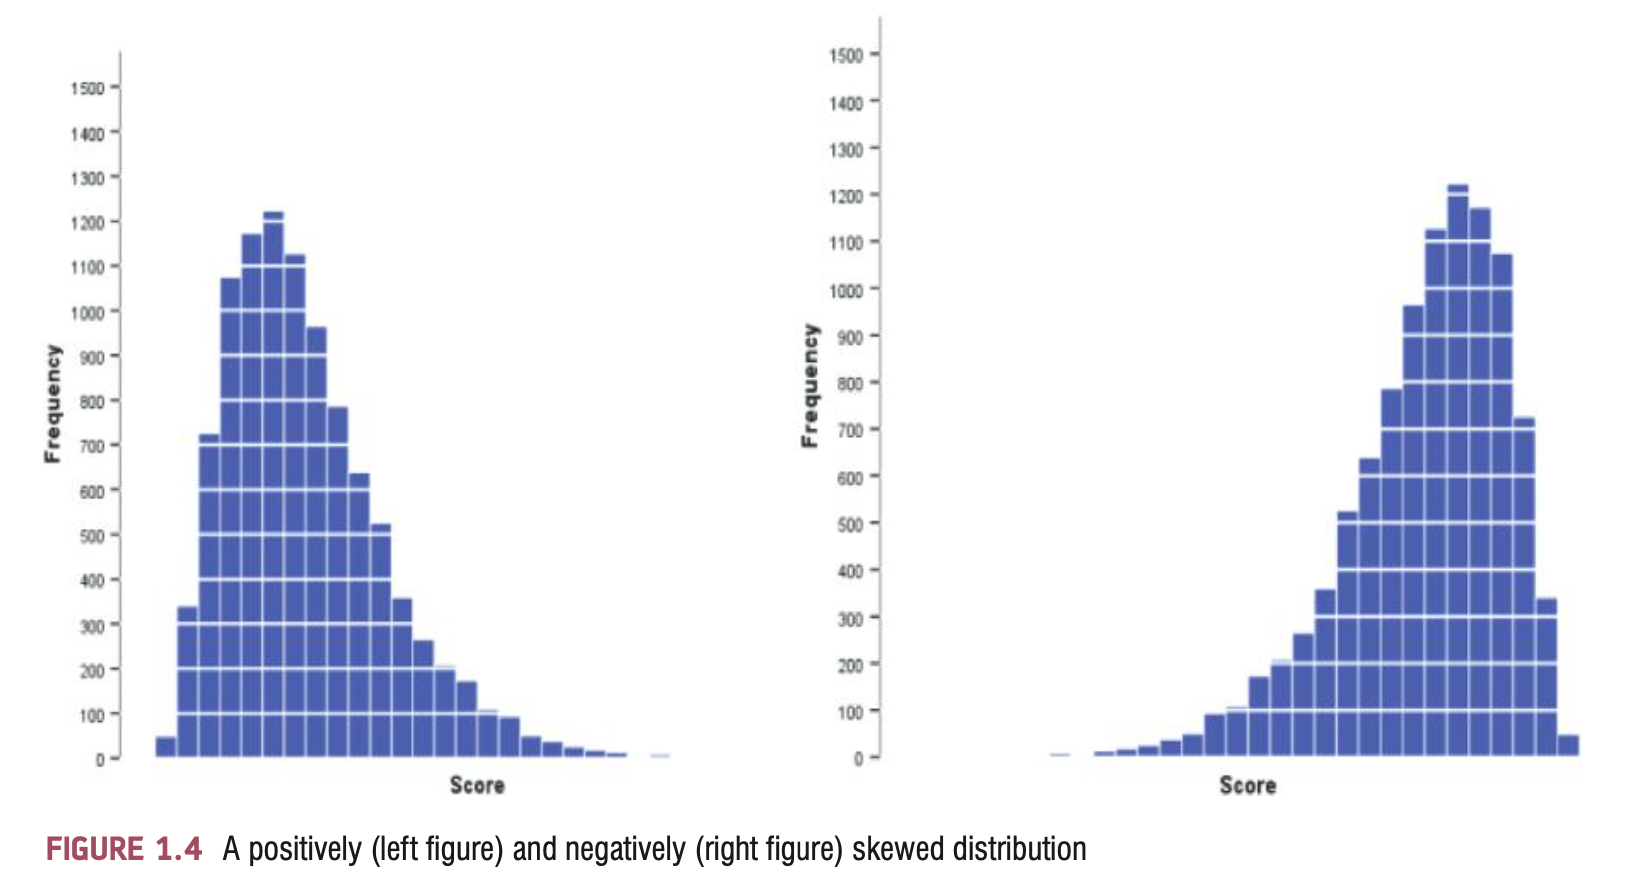
Skewness
A skewed distribution can be either positively skewed (the fre- quent scores are clustered at the lower end and the tail points towards the higher or more positive scores) or negatively skewed (the frequent scores are clustered at the higher end and the tail points towards the lower or more negative scores).
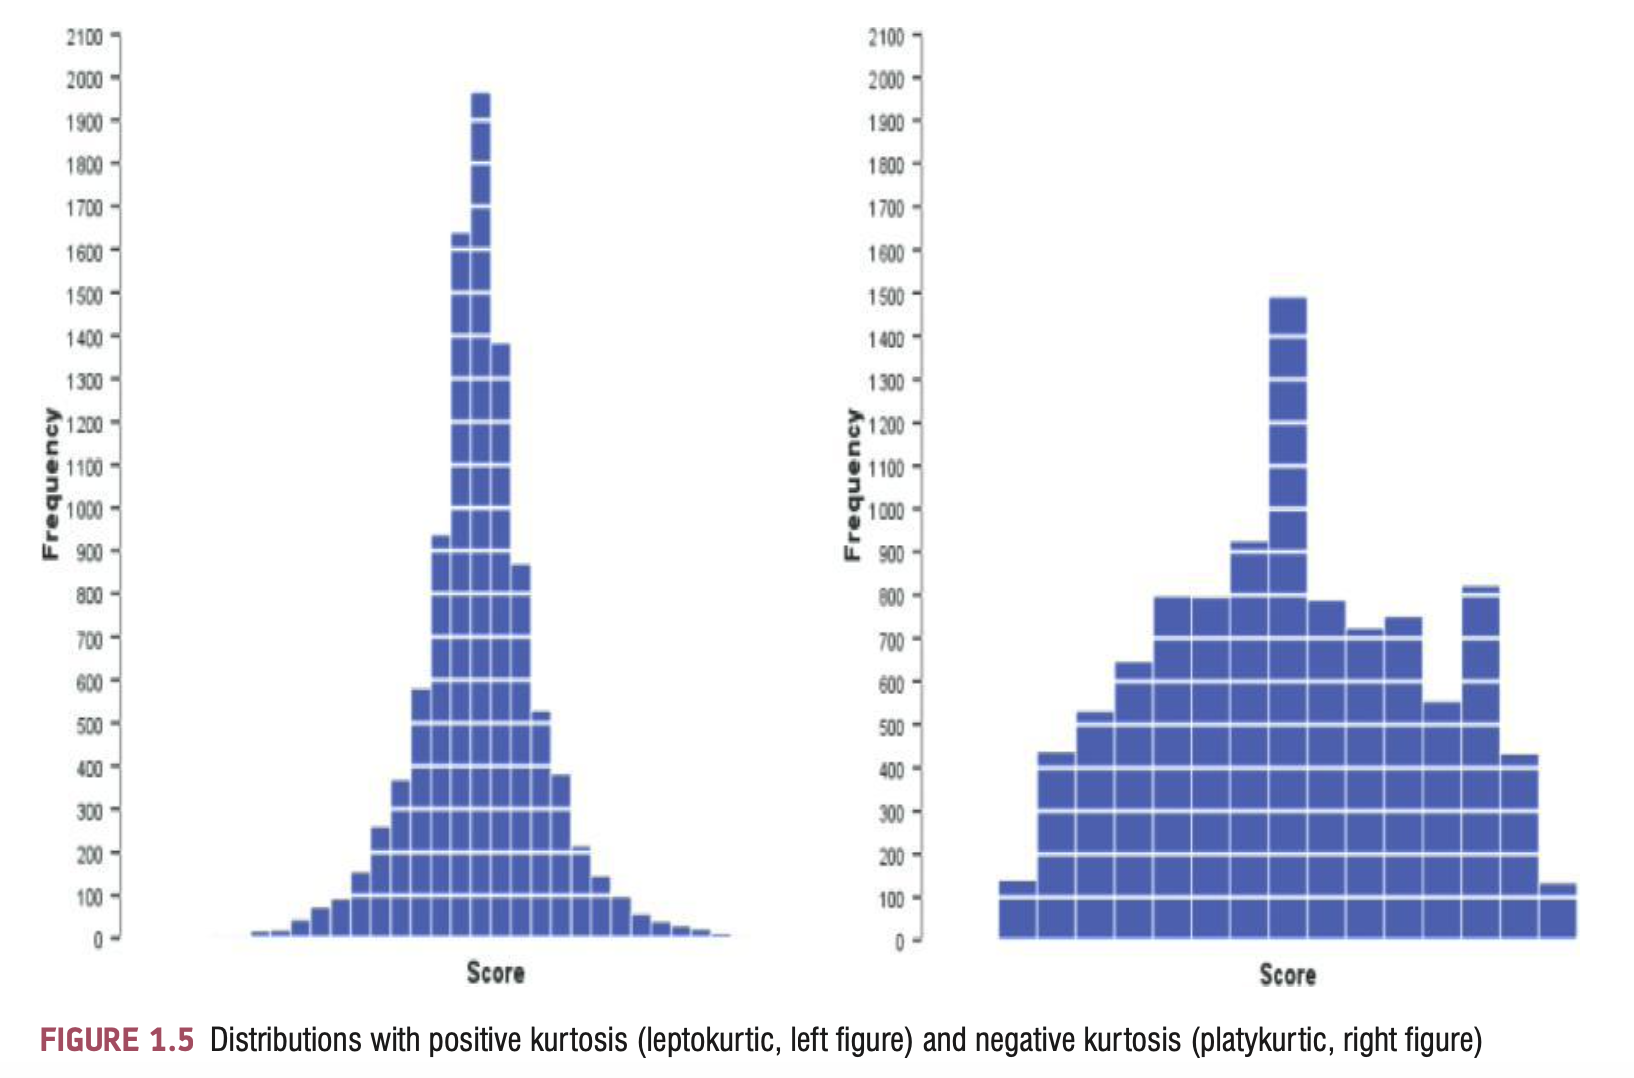
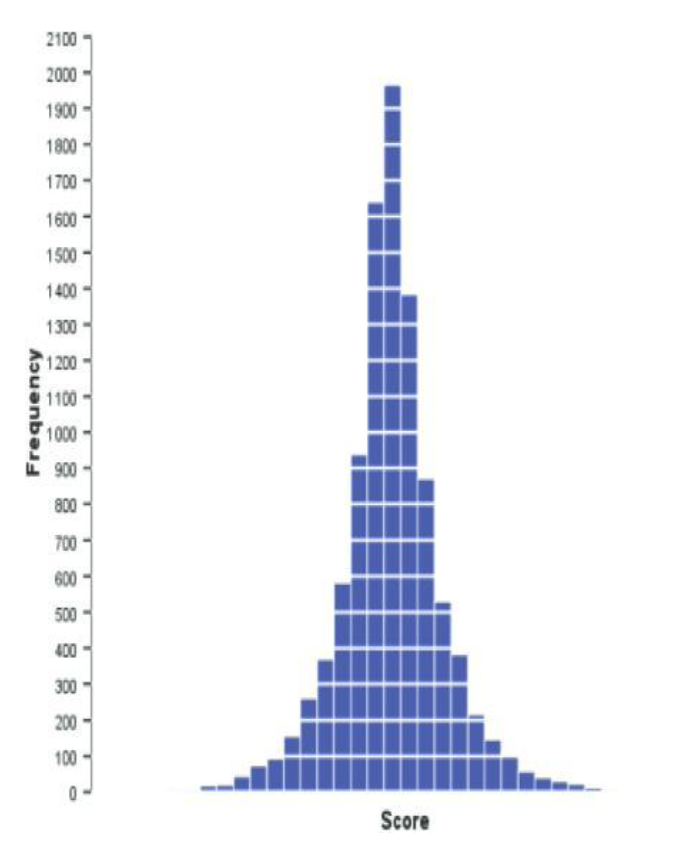
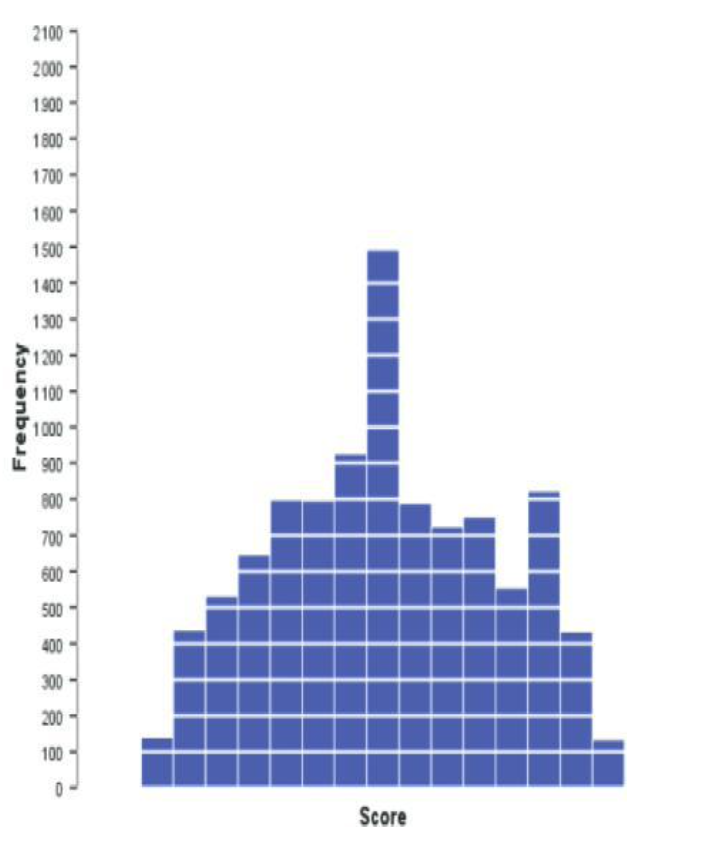
Kurtosis
Refers to the degree to which scores cluster at the ends of the distribution (known as the tails) and how pointy a distribution is
Bessel’s correction
Bessels’ correction refers to the “n-1” found in several formulas, including the sample variance and sample standard deviation formulas. This correction is made to correct for the fact that these sample statistics tend to underestimate the actual parameters found in the population.
Degrees of freedom
Degrees of freedom of an estimate is the number of independent pieces of information that went into calculating the estimate. It’s not quite the same as the number of items in the sample. In order to get the df for the estimate, you have to subtract 1 from the number of items. Let’s say you were finding the mean weight loss for a low-carb diet. You could use 4 people, giving 3 degrees of freedom (4 – 1 = 3).
Positive kurtosis
A distribution with positive kurtosis has many scores in the tails (a so-called heavy-tailed distribution) and is pointy. This is known as a leptokurtic distribution.
Negative kurtosis
A distribution with negative kurtosis is relatively thin in the tails (has light tails) and tends to be flatter than normal. This distribution is called platykurtic
Sampling frame
In statistics, a sampling frame is the source material or device from which a sample is drawn. It is a list of all those within a population who can be sampled, and may include individuals, households or institutions.
Convenience sampling
Non-random sampling method. Units are selected for inclusion in the sample because they are the easiest for the researcher to access.
This can be due to geographical proximity, availability at a given time, or willingness to participate in the research.
Snowball sampling
Non-random sampling method. Also known as chain sampling or network sampling, snowball sampling begins with one or more study participants. It then continues on the basis of referrals from those participants. This process continues until you reach the desired sample, or a saturation point.
Purposive sampling
Non-random sampling method. Units are selected because they have characteristics that you need in your sample. In other words, units are selected “on purpose” in purposive sampling.
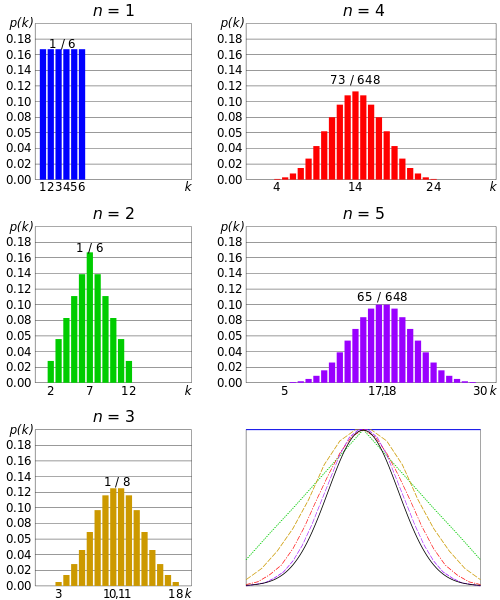
Central limit theorem
The Central Limit Theorem states that the sampling distribution of the sample means approaches a normal distribution as the sample size gets larger — no matter what the shape of the population distribution. This fact holds especially true for sample sizes over 30. Here’s what the Central Limit Theorem is saying, graphically. The picture below shows one of the simplest types of test: rolling a fair die. The more times you roll the die, the more likely the shape of the distribution of the means tends to look like a normal distribution graph.
Undercoverage bias
Undercoverage bias occurs when a part of the population is excluded from your sample. As a result, the sample is no longer representative of the target population. Non-probability sampling designs are susceptible to this type of research bias.
Sampling bias
Sampling bias occurs when some members of a population are systematically more likely to be selected in a sample than others. It is also called ascertainment bias in medical fields.
Sampling bias limits the generalizability of findings because it is a threat to external validity, specifically population validity.
Non-response bias
Nonresponse bias happens when those unwilling or unable to take part in a research study are different from those who do.
In other words, this bias occurs when respondents and nonrespondents categorically differ in ways that impact the research. As a result, the sample is no longer representative of the population as a whole.
Socially desirable responses
aka social desirability bias. Social desirability bias occurs when respondents give answers to questions that they believe will make them look good to others, concealing their true opinions or experiences. It often affects studies that focus on sensitive or personal topics, such as politics, drug use, or sexual behavior.
Standard error of the mean
The standard error of the mean is the variability of sample means in a sampling distribution of means. The wider the distribution, the further the sample means tend to fall from the population mean. That’s not good when you’re using sample means to estimate population means! You want narrow sampling distributions where sample means fall near the population mean.
The variability of the sampling distribution is the standard error of the mean! More specifically, the SEM is the standard deviation of the sampling distribution. The SE tells you how far your sample statistic (like the sample mean) deviates from the actual population mean. The larger your sample size, the smaller the SE.
Outliers
Tested with boxplot. Outliers are stragglers — extremely high or extremely low values — in a data set that can throw off your stats. For example, if you were measuring children’s nose length, your average value might be thrown off if Pinocchio was in the class.
Statistical models
A statistical model is a collection of probability distributions on a set of all possible outcomes of an experiment. This means that the model helps determine which results are likely to occur when given certain conditions. For example, if you are forecasting the weather, you would use a statistical model that takes into account factors such as air pressure, temperature, humidity, etc. to come up with a prediction. In other words, it uses probability distributions to create an understanding of how likely certain outcomes are under certain conditions.
Parameters
Dont change. Variables change. Mean is a parameter, variables are scores. T-test can also be a parameter. Outcomes of statistical procedures.
Confidence intervals
A confidence interval is how much uncertainty there is with any particular statistic. Confidence intervals are often used with a margin of error. It tells you how confident you can be that the results from a poll or survey reflect what you would expect to find if it were possible to survey the entire population. Confidence intervals are intrinsically connected to confidence levels. Confidence levels are expressed as a percentage (for example, a 95% confidence level). It means that should you repeat an experiment or survey over and over again, 95 percent of the time your results will match the results you get from a population (in other words, your statistics would be sound!).
H0 significance testing
If the sample provides enough evidence against the claim that there’s no effect in the population (p ≤ α), then we can reject the null hypothesis. Otherwise, we fail to reject the null hypothesis.
Although “fail to reject” may sound awkward, it’s the only wording that statisticians accept. Be careful not to say you “prove” or “accept” the null hypothesis.
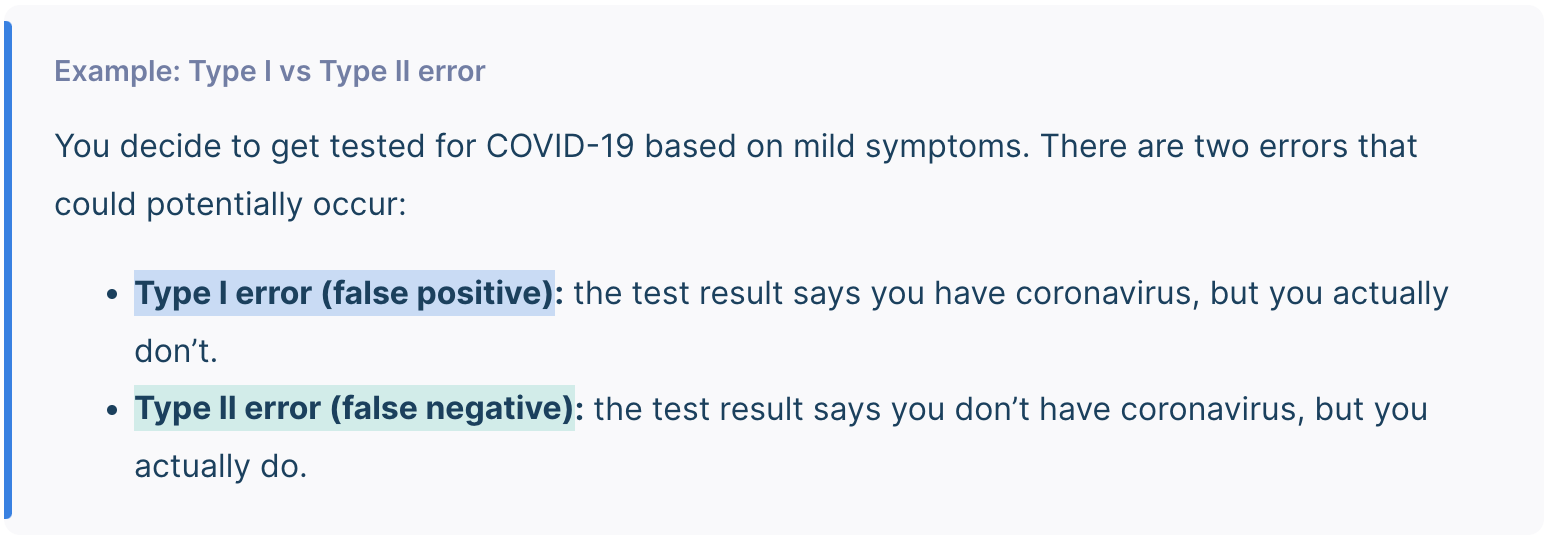
Type 1 error
You can never know with complete certainty whether there is an effect in the population. Some percentage of the time, your inference about the population will be incorrect. When you incorrectly reject the null hypothesis, it’s called a type I error.
Type 2 error
A Type II error means not rejecting the null hypothesis when it’s actually false. Type II error means failing to conclude there was an effect when there actually was. In reality, your study may not have had enough statistical power to detect an effect of a certain size.
Which variables fit t-test?
Quantitative dependent variable, categorical independent variable
When can a t-test be used? use real world examples
Experimental conditions to which people are assigned:
Control group and treatment (or experimental group)
(Between-group or independent design).
Groups based on a mutually exclusive characteristic, for
example gender.
In the first case group membership is manipulated,
determined by the researcher, in the second case group
membership is naturally observed.
When analyzing difference between groups, predictor
variable (grouping variable) is always categorical.
Dependent aka outcome variable (should be) is continuous –
interval or ratio. (However, ordinal data can work too).
Predictor/grouping variable
independent variable
Covariance
Covariance in statistics measures the extent to which two variables vary linearly. The covariance formula reveals whether two variables move in the same or opposite directions.
Covariance is like variance in that it measures variability. While variance focuses on the variability of a single variable around its mean, the covariance formula assesses the co-variability of two variables around their respective means. A high value suggests an association exists between the variables, indicating that they tend to vary together.
Correlation coefficients
Rationale for the t-test
Two samples of data are collected and the sample means calculated.
Means vary from sample to sample, and we use standard error as a measure of how much means fluctuate => we use SE as an estimate of the error in our model.
Null hypothesis: means from two random samples are very similar => they come from one population.
If the means are significantly different, they come from different populations.
The larger is the difference between the sample means (relative to the standard error – shows variability between the samples), the more likely it is that the two sample means differ because of the effect of manipulation (the independent variable).
What are the conditions needed for a t-test?
1. Correct variable types (Dependent variable should be quantitative; Independent variable should be categorical with two levels)
2. Independent or paired samples (Independent samples: One data point per participant; Paired samples: Two data points per participant)
3. Normal distribution
4. Homogeneity of variance (The variance should be roughly equal per group; Needed if your groups have different sample sizes; Rule of thumb: Largest SD should be less than twice as big as the smallest)
T-test process
Create a hypothesis and determine significance level.
Test assumptions -> see practical 5 on Thursday.
Prepare necessary calculations (M, S2 ) – SPSS does this for you.
Calculate t-value – SPSS does this as well.
Compare t-value against t critical value using the t critical value table. This is a value we would expect to get if our null hypothesis was true.
If the t-value we calculated exceeds the critical value at our level of significance, then we are confident that the difference between groups exists, and it is significant.
Compare t-value against t critical value using the t critical value table. This is
a value we would expect to get if our null hypothesis was true.
If the t-value we calculated exceeds the critical value at our level of significance, then we are confident that the difference between groups exists, and it is significant.
Significance level (α)
“chance for error”, the chance that your reject a null hypothesis (and accept an alternative hypothesis) by mistake.
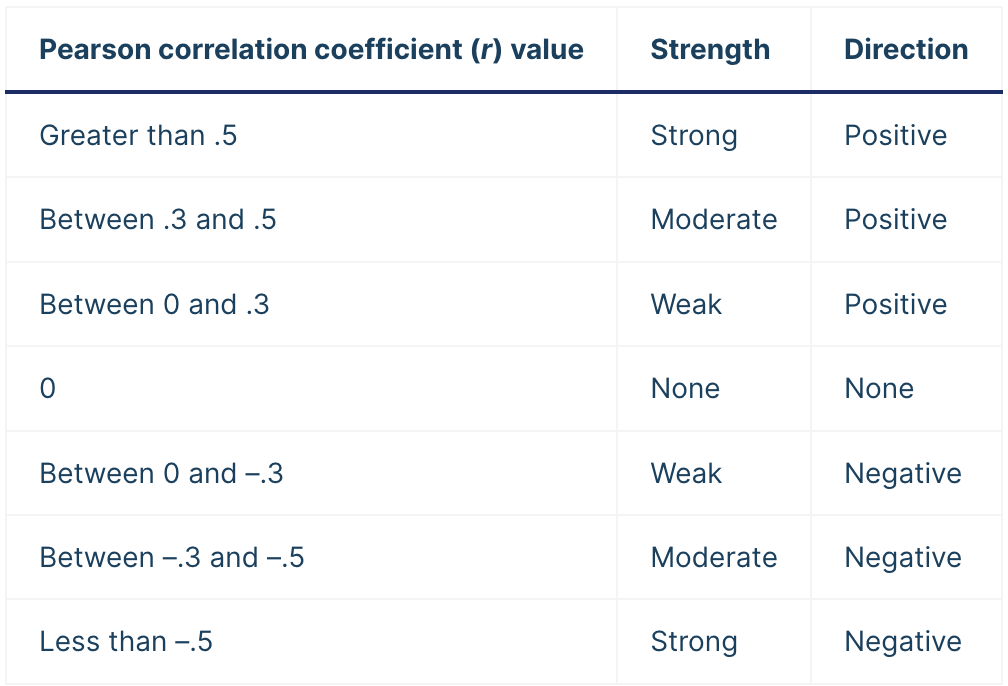
Pearson’s r
The Pearson correlation coefficient (r) is the most common way of measuring a linear correlation. It is a number between –1 and 1 that measures the strength and direction of the relationship between two variables.
When to calculate effect size?
Effect size tells you how meaningful the relationship between variables or the difference between groups is. It indicates the practical significance of a research outcome. A large effect size means that a research finding has practical significance, while a small effect size indicates limited practical applications.
Knowing the expected effect size means you can figure out the minimum sample size you need for enough statistical power to detect an effect of that size.
Once you’ve collected your data, you can calculate and report actual effect sizes in the abstract and the results sections of your paper.
Paired samples
• This is also known as matched or related samples, which is not a common situation!
• Same individuals at 2 different times before and after some potentially relevant event.
• e.g.: You take a stats test before and after taking Statistics in Media
• Matched pairs of individuals, similar in all respects except the one defining the two samples.
• e.g.: Educational psychologists comparing abilities of identical
twins (no genetic difference) who have been brought up separately or educated differently.
• If you can’t match pairs of observations, the samples are not paired.
• If the sample sizes are unequal, they are not paired.
Paired t-test (paired sample test)
A paired t-test is used to compare a single population before and after some experimental intervention or at two different points in time (for example, measuring student performance on a test before and after being taught the material).
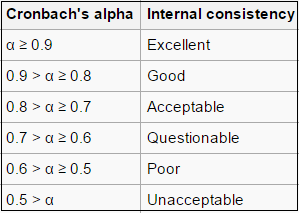
Cronbach’s alpha
To check the internal reliability of a scale (when using sub-scales in the questionnaire), we use Cronbach’s alpha measure.
We can also use Cronbach’s alpha when we want to combine several questions together, to check whether there is a consistency between them on theoretical and statistical levels.
This reliability test will produce a value between 0 (no reliability) and 1 (perfect reliability).
Issues with Cronbach’s alpha
A high level for alpha may mean that the items in the test are highly correlated. However, α is also sensitive to the number of items in a test. A larger number of items can result in a larger α, and a smaller number of items in a smaller α. If alpha is high, this may mean redundant questions (i.e. they’re asking the same thing).
A low value for alpha may mean that there aren’t enough questions on the test. Adding more relevant items to the test can increase alpha. Poor interrelatedness between test questions can also cause low values, so can measuring more than one latent variable.
Testing for homogeneity of variance
Levene’s test
Similar to normality tests
SPSS - Analyse → descriptions → explore → plots → normality plots with tests
Which type of test?
Check whether quantitative variables are related (without
hypothesizing a cause-and-effect relationship).
e.g. ”How are time spent on Instagram and money spent on clothes related?”
Correlantion
Which type of test?
Compare differences among group means.
e.g. “What is the difference in average screen time of Instagram users from the two groups?”
T-test