


Ch 6 - Costs of Production
(Microeconomics)
Long-Run vs. Short-Run
Long run: when all resources used by a firm in production are variable and supply can adjust to changes in demand
Short run: is where at least one production method is fixed and supply is not able to fully get accustomed to changes in demand
Law of diminishing returns:
As a firm adds an increasing amount of variable resources to a fixed resource, the additional production will eventually decrease.
In the short run, labour is added to fixed inputs which increases production at a steady rate in the beginning, then, production halts and stops producing at a productive rate. Later on, the total production ends up decreasing as more labour is added.
Ex: the more workers (labour) added to do an unchanging (un-expanding) task, the more crowded it will become and output will become less efficient.
Production Function:
Average Product (AP): total product divided by the number of labour inputs
Marginal Product (MP): change in production with an additional worker
Total product (TP): total production
AP = total output/variable inputs
MP = change in output/ change in input
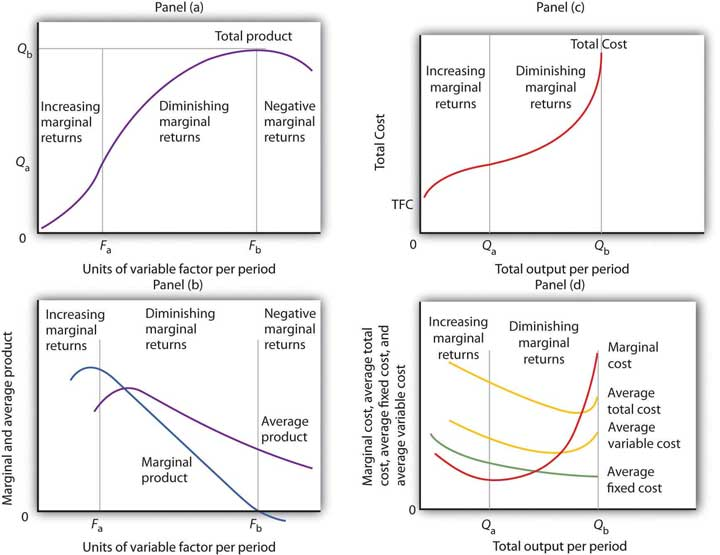
Increasing Marginal Returns: is the total product increasing at an increasing rate. At this point, the additional labour is productive to the market
Diminishing marginal returns: the additional factors of production lead to a decrease in output or productivity. Each additional worker will contribute less and less to the production of goods and services
Negative marginal returns: occurs when the total product is failing, and marginal revenue turns negative as the additional factors of production reduce productivity instead of add to it
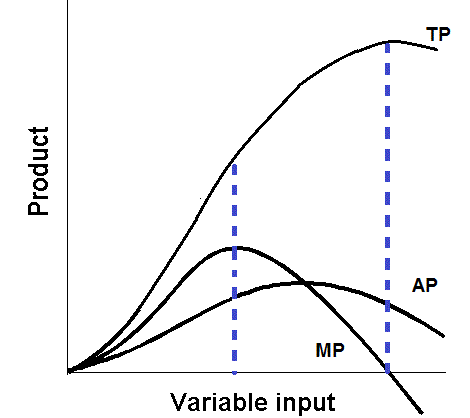
MP and Marginal cost curves are mirror images of each other. The AP and average variable cost are also mirror images . When TP is at its highest point, MP turns negative.
Production costs in the short run
Total costs include fixed costs and variable costs. In the short run, at least one factor of production will be fixed.
Total Fixed Costs (TFC): are those that do not vary with changes in output. In the short run, costs stay constant. These costs have to be paid even if the firm is not producing output. Example: rent, insurance, capital equipment
Total Variable costs (TVC): these costs vary as output changes. When there is no production, variable costs are zero. This includes changes in the number of employees, travel expenses, and energy costs.
Total Costs (TC): these costs are the sun of both variable and fixed costs
Formula: Total cost = TFC + TVC
Calculating Costs
Average Fixed costs (AFC): is the fixed costs that does not change with the change in the number of goods and services produced by a company
Formula**: AFC** = TFC/Q
Average Variable costs (AVC): Is the costs of all variable expenses which are involved in producing a product
Formula**: AVC** = TVC/Q
Average total costs (ATC): Is the total costs needed to produce goods
Formula**: ATC** = TC/Q
Marginal costs (MC): is the change in total costs from the production of one more unit of output. This is the cost added to a firm when the production of goods decreases the efficiency in output
MC = Change in TC / Change in Q
Relationship between Cost and Product Curves:
The relationship between MP to AP are the opposite of that of MC and AVC. This is due to the marginal curve being less than the average as it is declining. When the marginal curves are greater than the averages, the averages increase.
The MP curve intersects with the AP curve at the maximum point on AP, however, the MC curve intersects with the ATC and AVC curves at the minimum point of the average curve. Due to the law of diminishing marginal returns, each added unit of labour leads to less and less of the total product. This means that the extra workers added on this project contribute less and less to the end result of the total product.
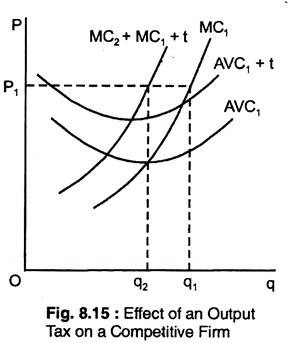
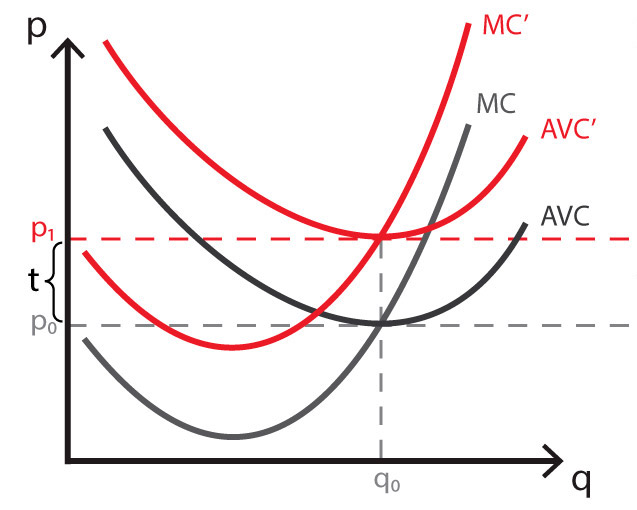
Important changes in cost curves is taxes:
Per-unit taxes: this is a tax added on each extra unit of output produced. In the case of Per unit taxes, the amount of taxes paid increases as the output increases. This means that the costs are variable, and not fixed. A per unit tax changes the marginal cost, and also the profit maximising MR=MC quantity.
The average cost does not change in this case
Lump-Sum Taxes: is a fixed and unchanging tax regardless of the amount a firm produces. This type of tax affects only fixed costs, and not variable. The lump-sum tax will not change or affect the amount produced, neither will it affect their price. The only curves that shift are the AFC and ATC, as ATC is the total of the variable and fixed costs.
Type of Tax | Cost Curves Affected |
|---|---|
Per-unit tax (excise tax) | Marginal Cost (MC), Average total cost, average variable cost |
Lump-Sum tax | Average fixed cost, Average total cost |
In the long run, all resources are variable, and inputs used in production can be changed. In the short run, at least one resource used in production will be fixed.
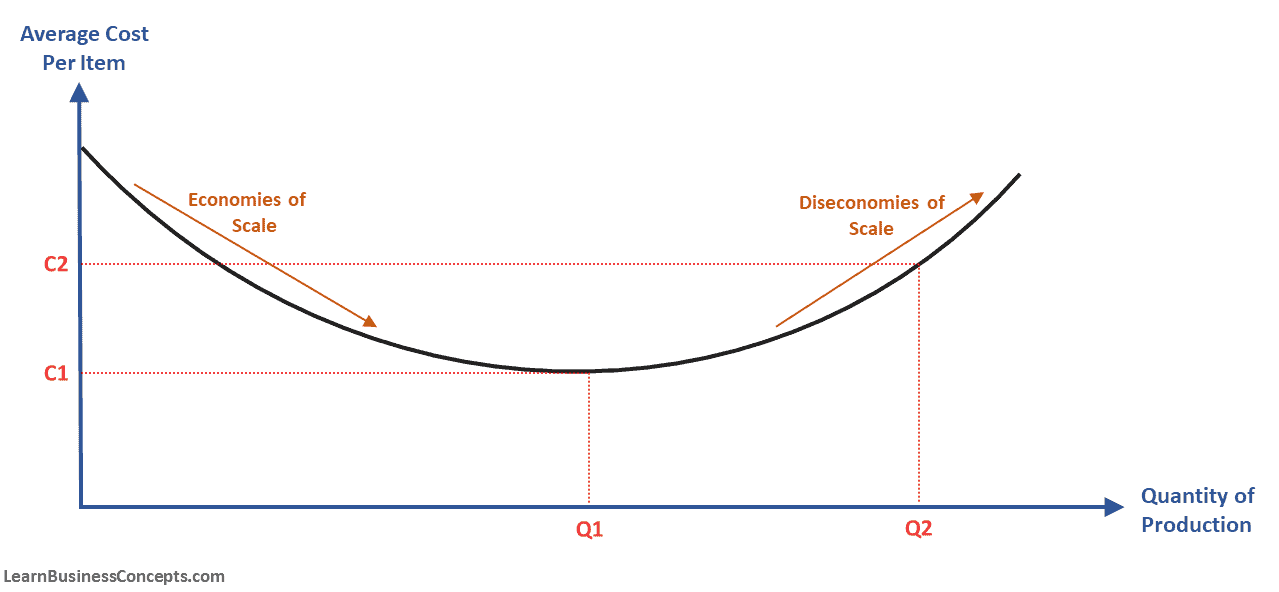
Stages of the long run average total cost curve
Economies of Scale: are when the long run average total cost curve decreases as the output increases. This is equal to increasing returns to scale. When inputs are increased by a certain percentage, output increases more than the given percentage. This occurs when the firm increases its production with its first three factories.
Constant Returns to Scale: occurs when the long run average total cost curve remains constant as the production either increases or decreases
Diseconomies of scale: when the LR average total cost curve increases as a firm’s output increases.
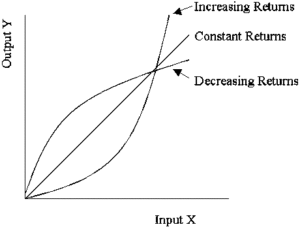
Returns of Scale
This is the returns of changes in output after all inputs have been changed by the same factor. This tests and determines how proportional these factors of production are.
If a firm doubles all inputs used in production, and the output more than doubles, the firm is experiencing increasing returns to scale
If a firm doubles all inputs used in production, and output less than doubles, it is decreasing returns to scale
If a firm doubles all inputs used in production, and output doubles, it is experiencing constant returns to scale
Economic & Accounting Profit:
The way each of these profits measure costs is the main key difference between them. While accounting profit considers costs such as labour, rent, equipment and others, Economic profit is mainly concerned with not directly visible, implicit costs when calculating profit.
Accounting profit is the net income of a company when revenue explicit costs are subtracted. This leads to accurate bookkeeping.
Accounting profit = Revenue - Explicit costs Only
Economic profit is that which is concerned with economic profit, which equals revenue subtracted from explicit and implicit costs.
Economic profit = Revenue - explicit and implicit costs
A normal profit occurs when the condition of the economy equals zero economic profit. This means that the resources produced from a certain good or service cannot be made better of in any other activity.