
Ch 7 - Perfect Competition
(Microeconomics)
Introduction to Market Structures
The four Market Structures:
Vary from perfect competition to imperfectly competitive models of monopolistic competition and oligopoly to monopoly.
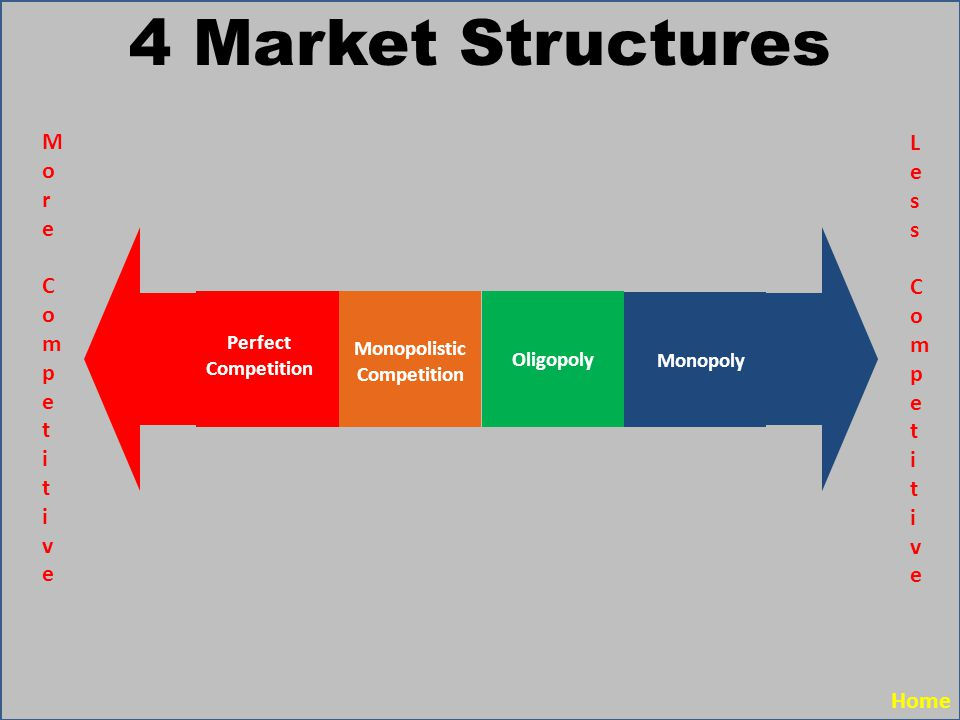
Perfect competition: Is the situation in the market where consumers and producers understand the absence of monopolies and the market price does not affect the price of the commodity. In this market, producers sell the same product and entry and exit into the market is easy.
Monopolistic competition: is an imperfect competition where producers produce opposing goods than each other however are competing against each other.
Oligopoly: is a type of competition in which one firm in different sectors will dominate the market.
Monopoly: In a monopoly market, the seller faces no competition as they are dominating the market, and have a major market share.
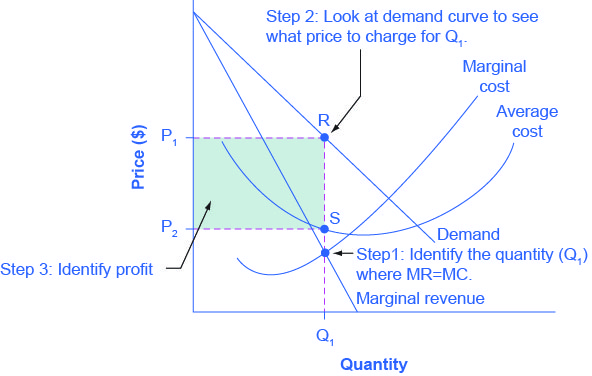
Profit-Maximising level of output:
Perfectly competitive firms and all other products maximise economic profit by producing where marginal revenue (MR) equals marginal cost (MC)
MR = MC is at this profit maximising level of output. The firm will not produce a lesser quantity than 8, as MR is greater than MC. Additional profit can be made by producing a greater quantity. If the firm produces a quantity of 10, MC>MR. The firm would lose money as it costs more to produce at the 10th unit than the revenue received.
General tip:
In order for a firm to be profit maximising, they should produce where MR = MC in every market structure.
Perfect Competition:
Are characterized by large numbers of sellers that complete in national and global markets. These are able to enter and exit a market as they have no influence on the price of the products the produce.
The prices of goods in a national or global market are determined by the firms in marge markets where all firms compete for the consumers of similar products. These producers aim to provide top tier quality products in order for them to be different than other producers of the same product.
If a firm were to set their own prices and charge more, it would lead to a loss in consumers (sales), which is why each firm opts to sell at the equilibrium price set in the market.
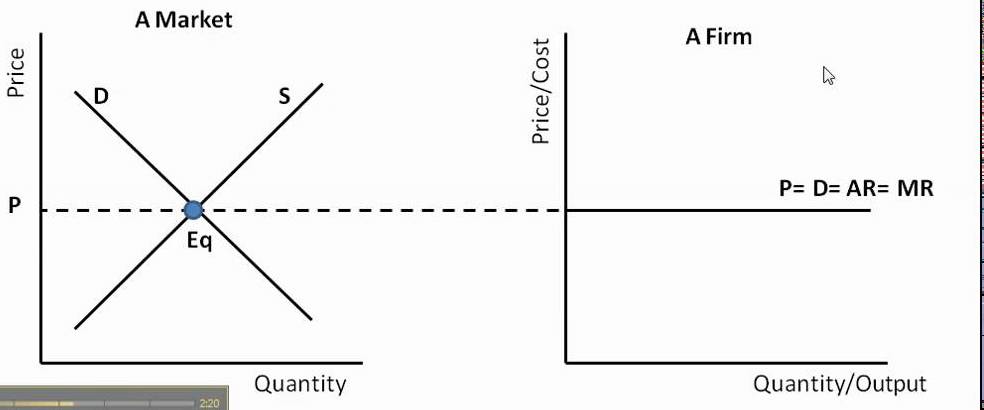
As we can see, the P factor is constant which indicates that the firm is a price taker. This creates a perfectly elastic firm.
Efficiency and Perfect Competition
A perfectly competitive firm in the long-run equilibrium leads to a situation that is unique to perfect competition and is not found in other markets.
Allocative Efficiency: when a firm produces the socially optimal output level where P=MC. Here, it means that the amount being produced is the exact amount which a society needs. More or less production of this good would be inefficient
Productive Efficiency: when a good is being produced, P=Minimum ATC, which is the lowest possible cost. This means that goods are produced at the lowest possible cost using fewest possible resources.
How to tell if the economy is in Perfect Competition?
Easy entry and exit
Firms do not set the prices, and are price takers
Products are identical
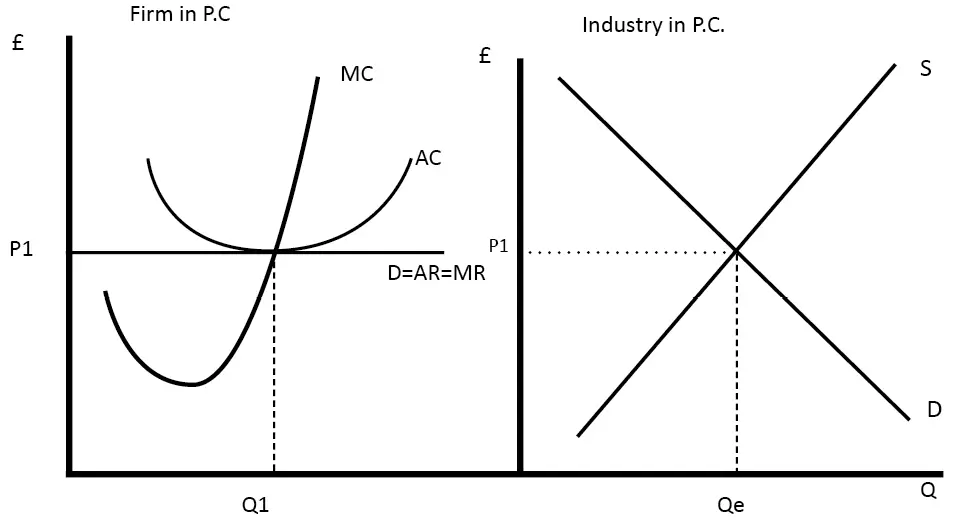
The demand curve is horizontal, or is perfectly elastic, as we saw in the perfect competition graph.
Zero long run economic profits
Allocatively efficient in the long run equilibrium
Productively efficient in the long run equilibrium
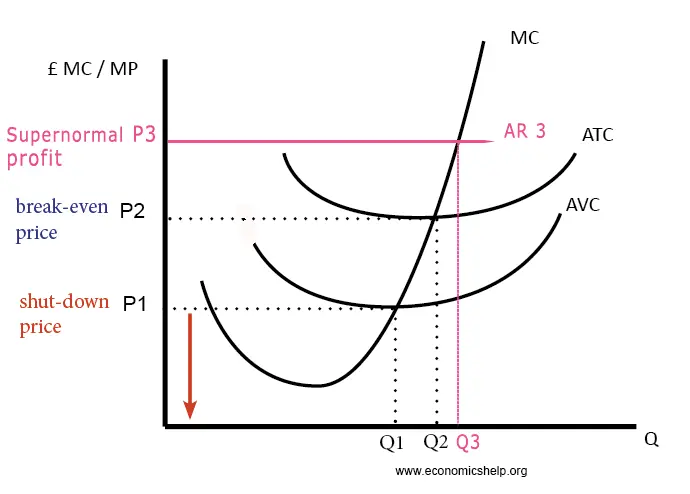
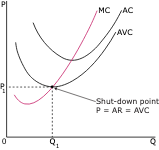
The Shutdown Price Rule:
States that firms should not produce when price falls below AVC. Even if a firm is operating at below ATC, they are at least able to cover all of their variable costs and some of their fixed costs. Firms often spend more money on shutting down the business completely. If a firm is experiencing MR=MC where P<AVC, it is more economical to shut down production and incur fixed costs.
TIP: A firm will shut down when P<AVC, and will produce when P>AVC, regardless of economic loss
Determining Profit:
For determining total profits or total losses at the profit maximising level of output, this formula can be used: Quantity * Price - Average Total Cost, Q(P-ATC). Therefore, if P>ATC, then the firm would be experiencing profits.
To compare the profit maximizing price with the average variable cost (AVC). If P=AVC or P>AVC, the firm continues to operate. If AVC<P, then the firm would shut down and are subject to all the losses.
If a firm continues to produce (P>AVC), the best output is where MR=MC
As a way to determine profit and losses, check if at best output P>ATC (profits) or ATC>P (losses). If the optimal profit is at Q, then for total profits Q(P-ATC); for total losses, Q(ATC-P)
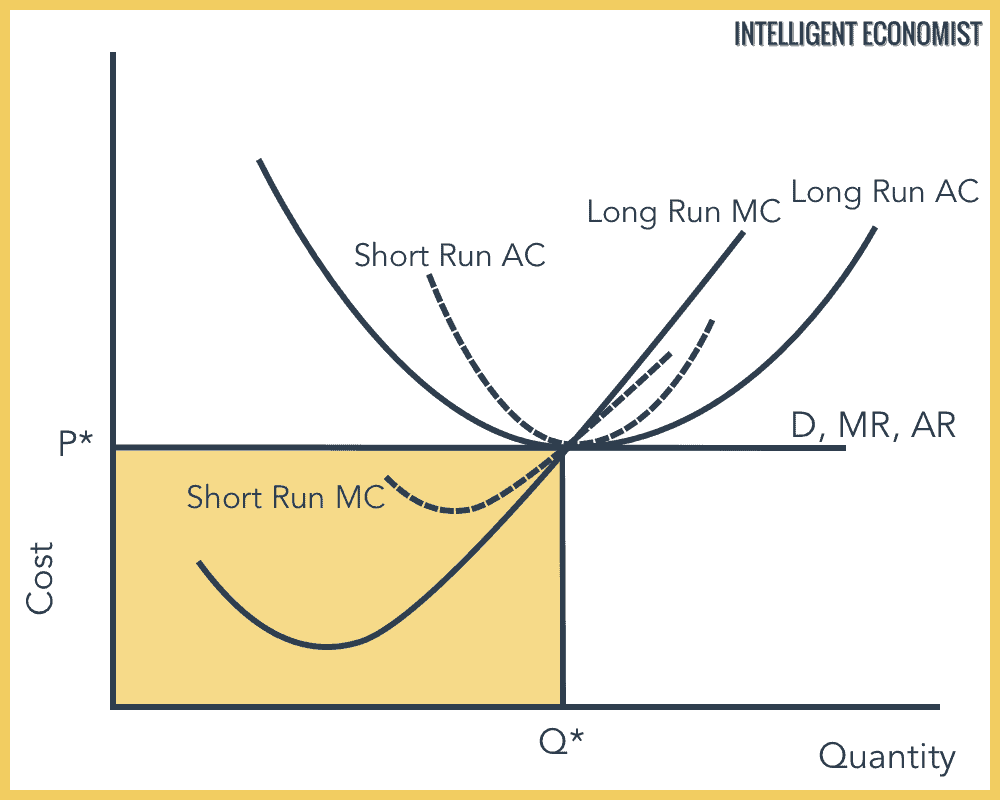
Perfect Competition in the long run
In the short run, perfectly competitive markets are more susceptible to earning economic profit than in the long run. The ability to gain profit will encourage new firms to enter the market, while losses influence them to leave the market. This occurs due to the market having easy entry and exit.
Formulas:
P < AVC : refers to firms which shut down in the short run
MR = D = AR = P: is the demand function of a firm in perfect competition
MC = MC: refers to profit maximisation
P = MC: is the efficient price which is under perfect competition in the long run
P = Minimum average cost: is the perfectly competitive firm in the long run
Q(P-ATC): is either the profit or loss