Chapter 30: Ecology and Populations
30.1 The Scope of Ecology
Ecology is the scientific study of the interactions of organisms with each other and their physical environment.
Ecology is one of the two biological sciences of most interest to the public today, the other being genetics.
Ecological studies offer information key to the survival of all species, present and future.
Understanding ecology will help us make informed decisions, ranging from what kind of car to drive to how to support the preservation of a forested area in our town.
Ecology involves the study of several levels of biological organization: individual organisms, populations, communities, ecosystems, and the biosphere.
Organismal ecologists study individual organisms and their adaptations to a particular environment.
A population is a group of individuals of the same species occupying a given location at the same time.
Population ecologists describe changes in population size over time.
A community consists of all the various populations in a particular locale.
Community ecologists study how the interactions between populations affect the populations’ well-being.
An ecosystem consists of a community of living organisms as well as their physical environment.
The biosphere is the zone at the Earth’s surface—air, water, and land—where life exists.

Ecology: A Biological Science
Ecology began as a part of natural history.
Natural history is the discipline dedicated to observing and describing organisms in their environment.
Ecology is also an experimental science today.
A central goal of ecology is to develop models that explain and predict the distribution and abundance of populations based on their interactions within an ecosystem.
Achieving such a goal involves testing hypotheses.
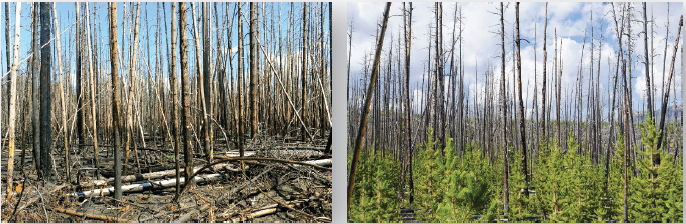
Ecologists might formulate and test hypotheses about the role fire plays in maintaining a lodgepole pine forest.
To test these hypotheses, ecologists can compare the characteristics of a community before and after a burn.
Ultimately, ecologists wish to develop models about the distribution and abundance of ecosystems within the biosphere.
Ecology and Environmental Science
Environmental science applies ecological principles to practical human concerns.
Ecological principles help us understand the importance of a functioning biosphere for our survival.
Overpopulation and overconsumption of resources pose threats to the biosphere.
Conservation biology is a discipline of ecology that studies biodiversity.
The goal of conservation biology is to conserve natural resources, including wildlife, for present and future generations.
Wildlife species are integral to a well-functioning biosphere, which is crucial for human life.
30.2 The Human Population
The human population covers most of the Earth.
The distribution of the human population is clumped on both large and small scales.
59% of the world's population lives in Asia, with most living in China and India.
Mongolia has a low population density of 0.25 persons per square kilometer.
Bangladesh has a high population density of over 1,000 persons per square kilometer.
Human population densities are highest along the coasts on every continent.
Present Population Growth
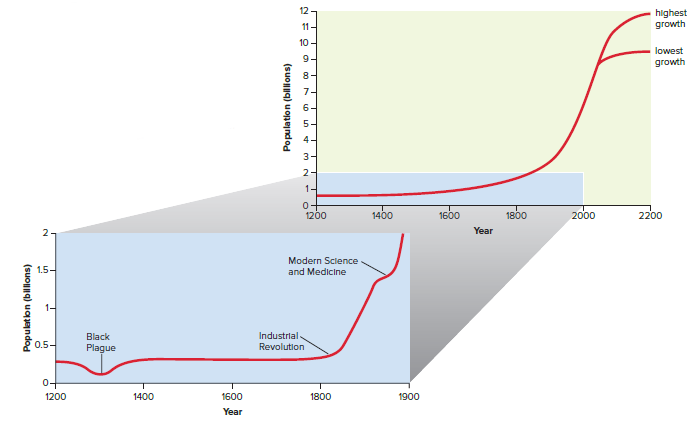
The global human population growth was slow for most of the twentieth century.
The growth rate began to increase as more individuals achieved reproductive age.
The Industrial Revolution brought an increase in food and medicine production and a decrease in the death rate.
The growth curve for the human population began to increase steeply during the Industrial Revolution.
Currently, the human population is undergoing rapid growth.
The growth rate of the human population is determined by the difference between the number of people born and the number of people who die each year.
The current global birth rate is estimated at 18.7 per 1,000 per year, while the global death rate is approximately 7.9 per 1,000 per year.
The current annual growth rate of the human population is 1.08%.
Future Population Growth
The future growth of the human population is a concern due to the possible exceeding of the resource supply rate.
The doubling time of the human population is estimated to be around 67 years.
Meeting demands for resources by such a large population increase in such a short period of time is a challenge.
Inadequate access to fresh water, food, and shelter already exists in some areas across the globe.
The world would need to double the amount of food, jobs, water, energy, and other resources in just 67 years to maintain the present standard of living.
Rapid growth declines when resources become scarce and the population levels off at the carrying capacity of the environment.
Carrying capacity is the number of individuals the environment can sustain for an indefinite period of time.
Earth's carrying capacity for humans is unknown; some authorities think it can support as many as 50 billion people, while others believe we may have already exceeded it and may undergo a catastrophic crash.
More-Developed Versus Less-Developed Countries
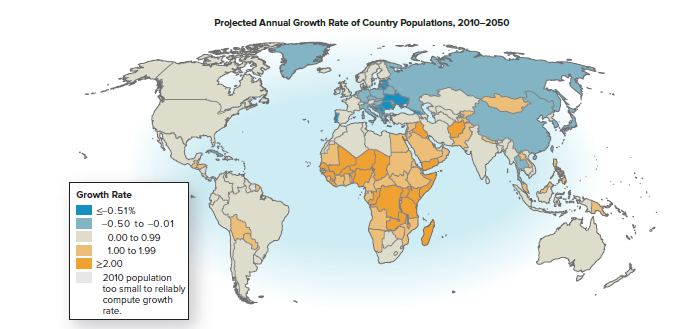
The growth rate of the human population is not the same in all countries.
Countries can be divided into two groups: more-developed countries (MDCs) and less-developed countries (LDCs).
MDCs have a modest growth rate and a good standard of living.
LDCs have a dramatic growth rate, and the majority of people live in poverty.
MDCs experienced a population boom between 1850 and 1950 due to modern medicine, improved socioeconomic conditions, and decreased death rate.
MDCs have experienced only modest growth since 1950 due to a decline in birth rate.
The growth rate for MDCs as a whole is now about 0.1%.
The United States has a growth rate of 0.78% due to immigration and a large number of women of reproductive age.
LDCs experienced a decline in death rate, but birth rates remained high.
The collective growth rate of LDCs peaked at 2.5% between 1960 and 1965 and has since declined to 1.5%.
Thirty-five LDCs are in sub-Saharan Africa, where women bear more than five children each.
By 2050, the population of LDCs is expected to jump to at least 8 billion, with the majority of the increase occurring in Asia.
Asia is already home to 59% of the human population and 31% of the world's arable land.
Twelve of the world's most polluted cities are in Asia.
If the human population increases as expected, Asia will experience more urban pollution, acute water scarcity, and a significant loss of wildlife over the next 50 years.
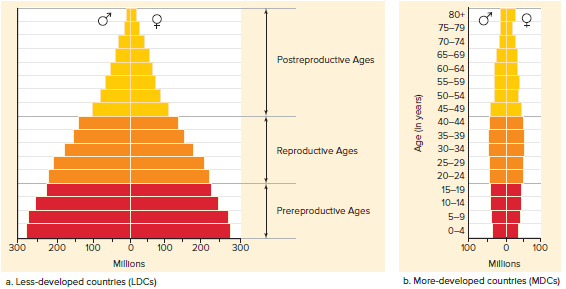
Comparing Age Structures
Population age structure is divided into three groups: pre-reproductive, reproductive, and post-reproductive.
MDCs have a stable age structure, meaning the number of individuals is about the same in all three groups.
MDC populations will grow slowly if couples have two children and decline if each couple has fewer than two children.
A birthrate of two children per couple is called replacement reproduction.
The replacement reproduction rate is often slightly greater than two children per couple due to mortality.
LDCs have a pyramid-shaped age structure diagram, with the pre-reproductive group being the largest.
LDC populations will continue to expand even if replacement reproduction is attained.
Replacement reproduction still results in population growth if there are more young women entering the reproductive years than there are older women leaving them.
Population Growth and Environmental Impact
Population growth is causing extreme pressure on social organization, Earth's resources, and the biosphere.
LDCs have a significant population growth rate, but it's not necessarily the main cause of environmental degradation.
MDCs consume a much larger proportion of Earth's resources than LDCs.
Excessive consumption by MDCs leads to environmental degradation, which is a major concern.
Environmental Impact
The environmental impact of a population is measured by population size, resource consumption, and pollution per capita.
Two possible causes of environmental impact are population size and resource consumption.
Overpopulation is more obvious in LDCs, while resource consumption is more obvious in MDCs.
Per capita, consumption is much higher in MDCs than in LDCs.
An average American family's per capita energy consumption is equivalent to 20 people in India.
Only a limited number of people can sustain the standard of living enjoyed in MDCs.
MDCs account for 1/4 of the world population but 90% of hazardous waste production due to high consumption of resources like fossil fuels, metals, and paper.
Figure 30.7 shows the comparative environmental impacts of MDCs and LDCs.
30.3 Characteristics of Populations
Populations undergo changes in their characteristics over time.
Populations experience environmental instability periodically.
During environmental instability, natural selection pressures individuals.
Individuals that are better adapted to the environment leave behind more offspring.
Adaptation to the new environment can lead to an increase in population size.
Characteristics of a population listed by an ecologist are a snapshot of a particular time and place.
Distribution and Density
Resources are components of an environment that support organisms.
Food, water, shelter, and space are important resources for populations.
Availability of resources influences spatial distribution of individuals.
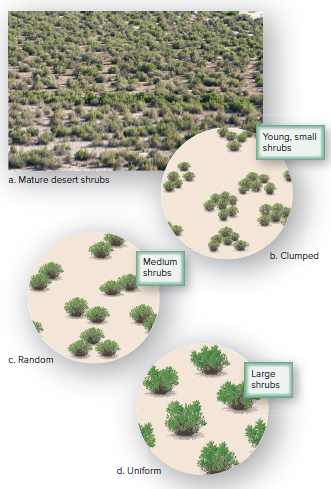
Clumped, random, and uniform distribution describe observed patterns of distribution.
Distribution of desert shrubs changes from clumped to random to uniform as plants mature due to competition for belowground resources.
Range is the portion of the globe where a species can be found.
Members of a population are clumped within the range because they are located in areas that contain the resources they require.
Population density is the number of individuals per unit area (or unit volume) of a particular habitat.
Population density tends to be higher in areas with plentiful resources than in areas with scarce resources.
Population density declines with increasing body size.
Tree seedlings show a much higher population density than do mature trees.
Population Growth
The growth rate of the human population is based on the number of births and deaths per year.
Growth occurs when the number of births exceeds the number of deaths.
Example: 30 births per year per 1,000 individuals and 10 deaths per year per 1,000 individuals = 2% growth rate.
If the number of deaths exceeds the number of births, the growth rate is negative, and the population is shrinking.
Demographics and Population Growth
Availability of resources and demographics affect the population growth rate.
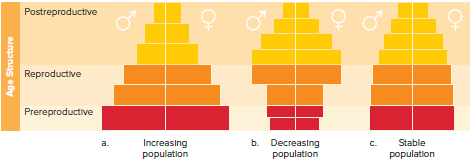
The age structure of a population is an important demographic characteristic.
Bar diagrams are used to depict age structure.
The population is divided into pre-reproductive, reproductive, and postreproductive individuals.
Birth rate exceeds death rate if pre-reproductive and reproductive individuals outnumber postreproductive individuals.
Death rate exceeds birth rate if postreproductive individuals outnumber pre-reproductive and/or reproductive individuals.
The population remains stable if the numbers of pre-reproductive, reproductive, and postreproductive individuals are approximately equal and the birth rate equals the death rate.
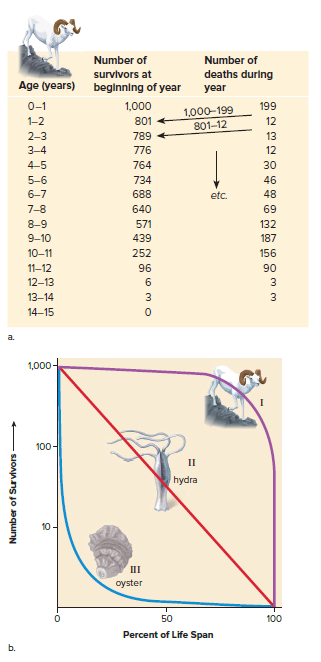
Survivorship patterns also influence population size.
The life table lists the number of individuals of each age or age range that are alive at a given time.
The survivorship curve shows the number of survivors per 1,000 births against age.
Three types of survivorship curves are common: type I, type II, and type III.
The biotic potential is the maximum growth rate of a population under ideal conditions.
Demographic characteristics affect whether a population achieves biotic potential, including the availability of resources, number of offspring per reproductive event, chances of survival until the age of reproduction, how often each individual reproduces, and the age at which reproduction begins.
Patterns of Population Growth
Population growth patterns depend on:
Biotic potential of the species.
Availability of resources.
Two fundamental patterns of population growth:
Exponential growth.
Logistic growth.
Exponential Growth
Ecologists are studying the growth of a population of insects that can infest and take over an area.
Exponential growth is expected under these circumstances.
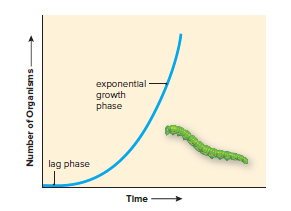
Exponential growth results in a J-shaped curve.
The growth pattern is similar to compound interest at a bank.
The J-shaped curve has two phases: The lag phase and the Exponential growth phase.
The lag phase is when growth is slow due to a small population.
The exponential growth phase is when growth is accelerating.
Exponential growth continues as long as there are sufficient resources available.
Competition for resources will increase when the population approaches the maximum number that can be supported by available resources.
Logistical Growth
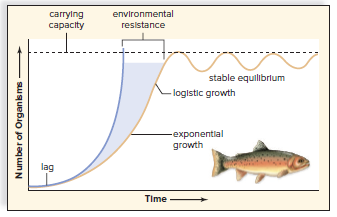
Exponential growth cannot continue for long due to environmental resistance.
Environmental resistance includes limited food supply, accumulation of waste products, increased competition, and predation.
Environmental resistance increases as the population grows larger.
Population growth levels off as resources decrease, resulting in logistic growth.
Logistic growth results in an S-shaped growth curve.
Characteristics of logistic growth include lag phase, exponential growth phase, logistic growth phase, and stable equilibrium phase.
The stable equilibrium phase occurs at the carrying capacity of the environment.
Carrying capacity tends to fluctuate around a value determined by current environmental resources.
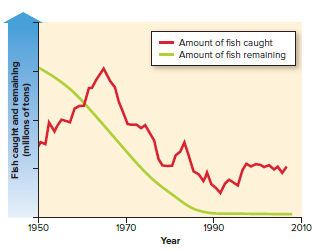
Logistic growth has practical applications, such as maintaining fish population size in the exponential phase for continuous food sources and reducing carrying capacity to limit pest growth.
Factors That Regulate Population Growth
Ecologists recognize biotic and abiotic components in the environment that regulate population size.
Density-independent factors are abiotic and can cause sudden reductions in population size, but their effect is not influenced by the number of individuals in the population.
Density-dependent factors are biotic, and their effect increases as the density of the population increases.
Competition, predation, and parasitism are examples of biotic factors that increase in intensity as population density increases.
Competition occurs when organisms compete for limited resources, which can limit access to resources necessary for survival, reproduction, or other aspects of an organism's life cycle.
Resource partitioning is a way to reduce competition for food, where different age groups of a species use different food sources.
Predation is when one organism, the predator, eats another, the prey.
Predation includes animals that kill other animals, filter-feeding animals, and herbivorous animals.
The effect of predation increases as the prey population increases in density.
Increasing the density of available prey increases the proportion of the population preyed upon.
Some predator and prey populations experience an increase, then a decrease, in population size, resulting in a boom-bust cycle.
The snowshoe hare and the Canada lynx experience a boom-bust cycle.
The decline in snowshoe hare abundance is accompanied by low growth and reproductive rates, which could be signs of food shortage.

30.4 Life History Patterns and Extinction
Life history consists of a mix of characteristics.
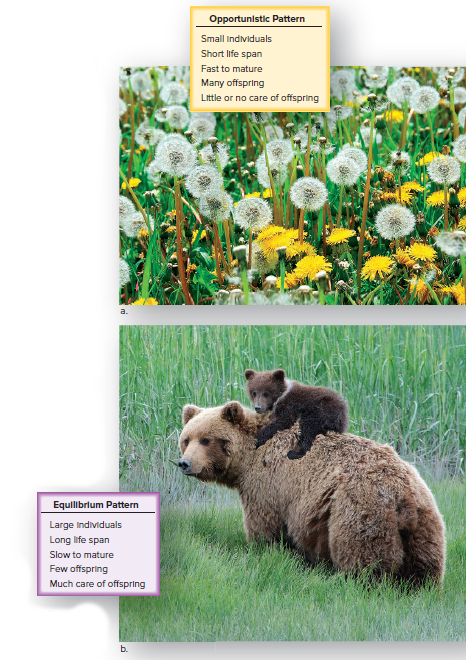
Ecologists have discovered two fundamental patterns: opportunistic and equilibrium.
Opportunistic species exhibit exponential growth, are small in size, mature early, have a short life span, provide limited parental care, and have a high dispersal capacity.
Density-independent factors regulate population size, which is large enough to survive an event that threatens to annihilate it.
Examples of opportunistic species include insects and weeds.
Equilibrium species exhibit logistic population growth, with the population size remaining close to or at the carrying capacity.
Resources are relatively scarce, and individuals best suited to the environment have the largest number of offspring.
Equilibrium species are fairly large, slow to mature, have a long life span, and allocate energy to their own growth and survival and to a small number of offspring.
Population growth of equilibrium species tends to be regulated by density-dependent factors.
Examples of equilibrium species include birds and mammals.
Extinction
Extinction is the total disappearance of a species or higher group.
Dandelion is more likely to withstand a local decimation than bears because it matures quickly, produces many offspring at one time, and has seeds dispersed widely by wind.
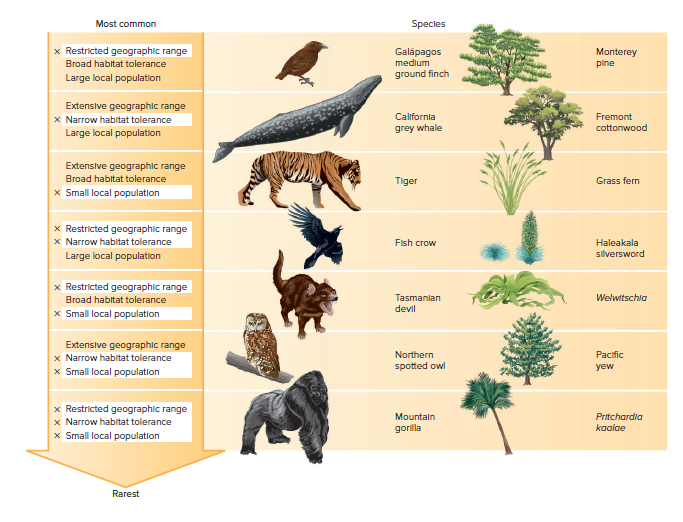
Equilibrium species can be in danger of extinction based on three factors: size of the geographic range, degree of habitat tolerance, and size of local populations.
Figure 30.20 compares 14 equilibrium species on the basis of these three factors.
The mountain gorilla has a restricted geographic range, narrow habitat tolerance, and small local populations, making it very vulnerable to extinction.
The possibility of extinction increases depending on whether a species is similar to the gorilla in one, two, or three ways.
Population studies can assist conservationists and others trying to preserve the biosphere’s biodiversity.