

APSC 101 Final Notes
Risk Management
Chapter 11, 18 Sections 18.1-18.3
Risk Factors
Severity: Maximum harm that could come from an incident
Likelihood: The probability of a harm causing accident
Hazard: Capacity to cause harm (in terms of safety)
Risk = Severity x Likelihood
What is Risk?
Possibility of harm occurring, determined from severity and likelihood.
Risk Sources:
Preventable
Risks that teams can manage and control
Strategic
Risks knowingly taken for potential rewards
External
Outside of the teams control, must be considered
Risk Types:
Safety
Related to health and wellbeing of people and environment
Technical
Design and manufacture, ensuring the solution works as intended
Project Management
Completion of project on time and with budget
Operational
Decision making on the operation and use of the device
Risk Categorization Table
Horizontal categories: Risk Sources (external, preventable, strategic)
Vertical categories: Risk Types (safety, technical… etc)
Use of Risk Categorization Table:
Documents and captures important risks
Focuses on different risk sources and categories
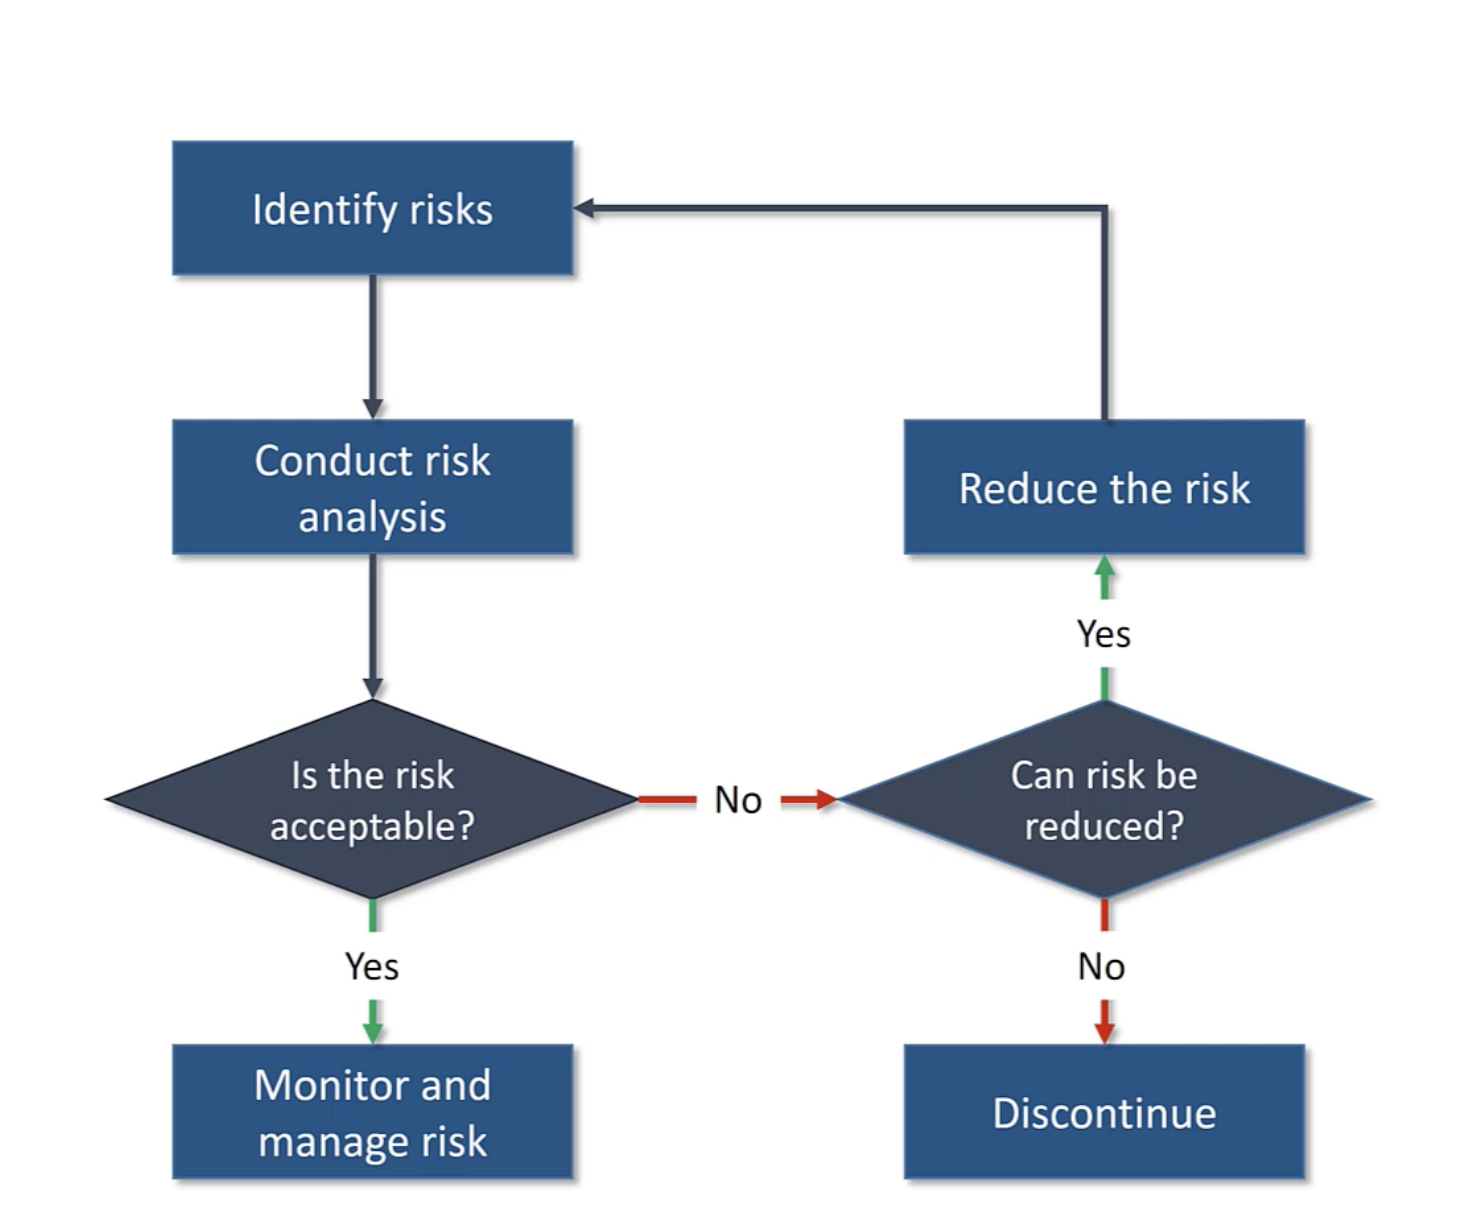
Risk Management Approaches:
Avoid
Change what you are doing to remove the risk entirely
Ex. Stopping the project, changing ideas
Mitigate
Try to minimize likelihood, severity or both
Ex. Changing certain aspects of your design
Transfer
Pass the risk to someone else
Ex. Insurance
Accept
Be willing to live with the consequences of your risk
Ex. Doing nothing
Risk Matrix
A tool for quantifying risk based on the product of likelihood and severity.
Vertical column: Likelihood increasing
Horizontal column: Severity increasing
Risk Analysis Chart
Team Development
Sections 17.2 and 17.4 ("Managing Conflict").
Tuckman’s Stages Chart
Team Completion and Team Relationship
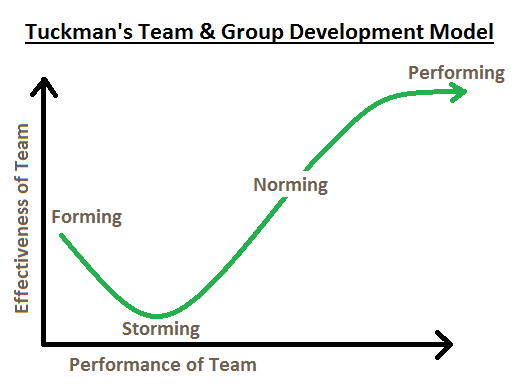
Tuckman’s Stages of Team Development
Forming
Everyone is polite, tries to contribute, minimizing controversy
Not well coordinated: strengths of team aren’t well utilized
Storming
More willingness to speak, however tension and disagreements are created
Quantity and quality of work decreases
Norming
Good Norming:
Mutual understanding of roles, goals and standards.
Bad Norming:
Dysfunctional, worried about awkwardness instead of resolving issues
Performing:
Strong group identity, healthy and supportive relationships, high value work
When does conflict occur?
Throughout all stages.
Forming: avoiding conflict
Storming: conflict in the open, stressful
Performing: dealing with conflict quickly and smoothly
Conflict ensures all opinions and voices are heard.
Transitioning through stages:
F→S
Time spent working together, leadership
S → N
Open Communication, real friendships, desire to improve
N → P
Willingness to face conflict
Valuing team relationships and accomplishments
Bad Norming → Good Norming
Courage to speak up against unfairness
Conflict Management Chart
Co-operativeness
Seeking to meet the other parties goals
Assertiveness
Seeking to meet our goals
 Vertical: Assertiveness Horizontal: Co-Operativeness
Conflict Management Styles
Avoiding
Ignoring the conflict, removing yourself from the situation
No one gets what they want
Accommodating
Being flexible to give up what you want for others
Competing
Pushing to achieve what you want, even if it upsets the others
Quick
Compromising
Meeting the other party in the middle
Both get what they want
Quick
Collaborating
Taking the time to listen and work together to come up with a solution everyone likes
Takes time and effort
Engineering Drawings
Sections 10.1, 10.2, and 10.3.
Projection
View used to represent a 3d object in a 2d space
Perspective Projection
Realistic perspective where closer features are larger, further are smaller
Principal View Projection
View from main sides: top, front, end
Multiview Orthographic
Multiple principle projection views
Pictorial Drawings
Look 3d but use parallel lines
Starting line is typically 30 degrees to 45 degrees to the horizontal
Isometric Projection
Pictorial drawing
Starting line 30 degrees from horizontal
Circular features are elliptical
Distances from axis are proportional to IRL
Vertical and Parallel lines match IRL
Uses reference lines
Hidden Lines Orthographic
Dashed lines used to show un-visible features
Orthographic Drawings
If you stood directly in front of a specific side, you see the face (view)
Third Angle Projection
Top view above front view, right view to the right of front view
Dimensioning Guidelines
Sufficient dimensions to describe the object
Dimension the view that shows features clearly
Diameter of circle: on the view that shows it
Diameter of cylinder: dimensioned from the side, cylinder appears a rectangle
Don’t dimension hidden lines
Dimensioning
Dimension Line
Line with arrows on the ends to show size or location of a feature
Don’t cross dimensions lines with each other
Shouldn’t be in the object
Extension Line
Straight reference line to identify features on an object and to which a dimension line points
Can cross with other extension lines if necessary
Centre mark
“+” symbol identifies the centre of a circular feature
Dashed line with a long-short pattern identifies centre of cylinder
2 Types of Dimensioning
Chain dimensioning
Style of dimensioning where a new dimension starts where a previous ends
Datum Dimensioning
Multiple dimensions start from the same datum
Title Block
Section used on an engineering drawing with critical information
What does a Title Block Contain?
Units of dimensions
Uncertainties of dimensions
Symmetric symbol: 3rd angle projection
Who created and checking the drawing and when
Material and quality of surface finish of item
Drawing Scale (1:1)
Name and number of drawing
Current drawing version
Feedback
Section 17.4 ("Giving and Receiving Feedback") and Section 15.2.
Equity Diversity and Inclusion
Equity:
Everyone has the same opportunities for success
Diversity:
Differences in background and identities allowing for more creativity and better performance
Inclusion:
Addressing inequities between people of different backgrounds and working towards a respectful community
Intersectionality
Overall experiences of discrimination or privilege based on dimensions of diversity
Biases
Implicit Biases:
Subconscious stereotypes about groups, learned through seen patterns
Microaggressions:
Small, subtle or indirect discriminatory actions or statements
Stereotype Threat:
When people feel concerned about conforming to a stereotype for a group they belong to
Allyship:
Acting to support individuals facing discrimination
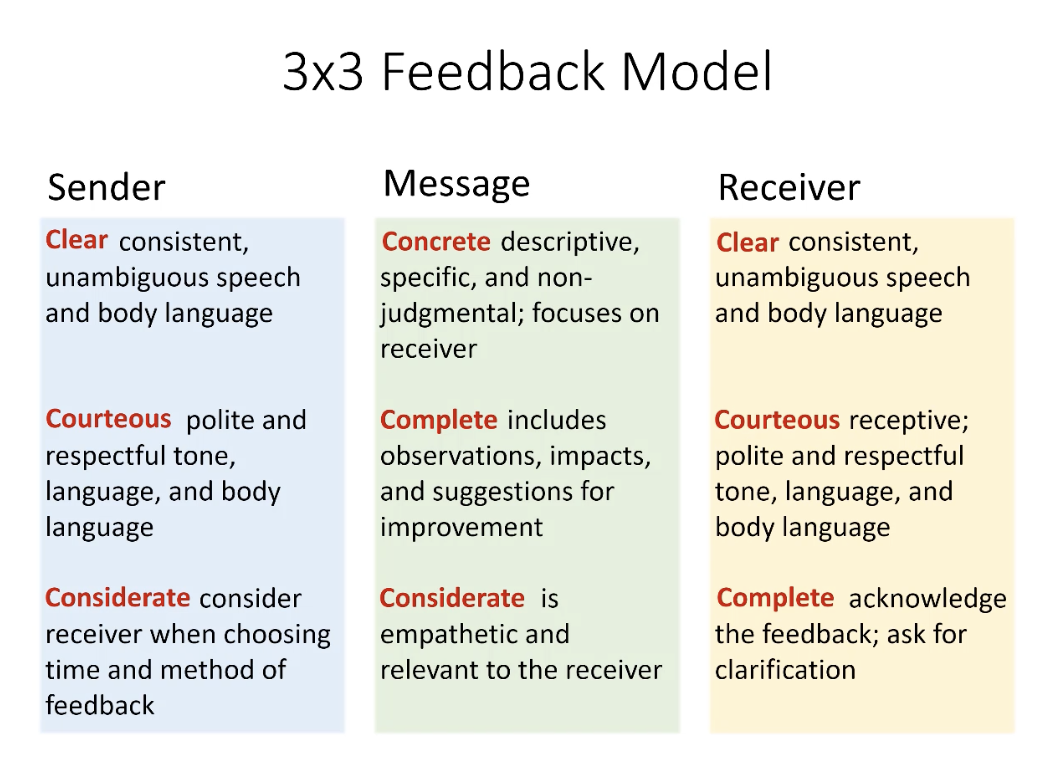
7 C’s of Communication
Clear
Easy to follow, direct, appropriate structure
Correct
Factually correct, free of errors
Concise
Brief and to the point without losing meaning
Concrete
Detailed, specific, intended message evident
Complete
Information the audience needs and what is expected
Courteous
Polite, friendly, sincere, appropriate honorific
Considerate
Empathetic and mindful
Takes into account audience and reaction (impact)
Technical Memo
Form of concise written communication, shares information (projects)
Structure Technical Memo
Sender’s address
Date
Inside address
Reference line
Salutation
Body
Closing (Signature and Name)
Enclosures
3 Types of Feedback
Appreciation
Acknowledge job well done
Coaching
Help someone improve
Evaluation
Rate someone’s performance against standards
3×3 Feed Back Model
Life Cycles
Sections 13.1, 13.3, and 14.1
3 Scales to Consider
Spatial
Physical largeness of a system
Temporal
Time, looking at now, into the future
Organizational
Based on organizational structures, such as government, schools, etc
Sustainability Venn Diagram
No trade-offs for sustainability
Environment
Clean air, safe environment
Society
Health, safety, human rights
Economy
Employment, business
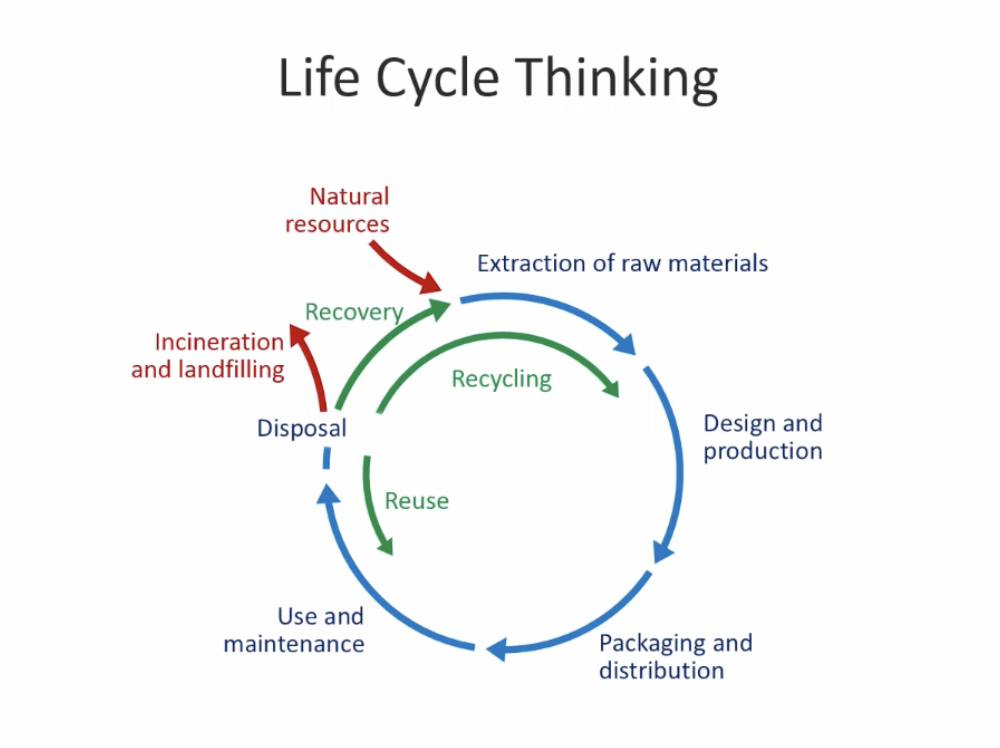
Life Cycle Thinking
Life Cycle Assessment LCA
Systematic Evaluation of the impacts of material and energy inputs and outputs for a product or process across all life cycle stages
Used usually near the end of the design process once everything is known
LCA Main Stages
Goal definition and scope
Defining system boundary, and which life cycle stages are we considering
Inventory Analysis
Tracking material influx and outflux, waste, manufacturing processes, etc.
Impact Assessment
Assessing environmental impacts
Established environmental impact metrics
Interpretation (All throughout)
Displaying our data (bar graph)
Cons of LCA
Detailed knowledge of material and energy flows is required
Impacts must be known and quantified
Focuses on environmental impacts
System Boundary
Description of what elements are included / excluded in an LCA
Ex. Examining a phone, determining if you’re also accounting for the electronics inside, as well as the glass screen… etc
Functional Unit
Reference of performance used to compare things in an LCA
Ex. Comparing emissions from cars vs busses, functional unit: emissions for 120 person-km of city driving
Streamlined Inventory Analysis SLCA
Sees the life cycle of materials as also a life cycle sequence
Used all throughout the design process
Life Cycle Sequence
Raw Materials → Production → Distribution→ Use → End of Life
Categories of an SLCA considered
Resources Used
Waste Generated
Energy Used
Public Health
How to use an SLCA?
Consider the life cycle sequence:
Raw Materials → Production → Distribution→ Use → End of Life
In each part of the sequence, rank on a scale of 1-5 for each category
Resources Used
Waste Generated
Energy Used
Public Health
Put data into an SLCA matrix and sum the values
SLCA vs LCA
SLCA is faster
SLCA is qualitative, better for difficult to quantify data
Suitable all throughout the design process
Technology
Section 12.3 ("Appropriate Technology")
Appropriate Technology: Meaning
Design solution considers key stakeholders across all lifecycle stages of that solution
Solution is appropriate for the context
Sustainability Venn Diagram

Sustainability: Context
Relevant factors in a problem that influence stakeholder consultation and the sustainability of a solution
Ex. Context needed for maintenance nearby, use after novelty wears off, interactions for citizens
Stakeholder Engagement
All throughout design process
Engage
Design, implement, and commit to processes of engagements that give stakeholders to opportunity to change their future
Learn
Understand and hear all perspectives
Synthesize
Integrate new stakeholder input in decisions, and tweak the project to suit them longterm
Business Letters
Format
Sender Address
Date
Inside Address
Salutation
Purpose
Details
Restate Purpose
Closing
Satisfaction Curves
Section 5.4 ("Evaluation Criteria")
Target Design Specifications
Requirements
Necessary components of a solution
Evaluation Criteria
Distinguish between different degrees of satisfaction
Design Parameters and Attributes
Parameters:
Inputs of a system
Ex. Battery capacity
Attributes:
Outputs
Ex. Cost of the battery capacity implementation
Satisfaction Curves:
Only looks at satisfaction for a certain aspect.
X Axis: Attribute
Something of importance to the stakeholder
Y Axis: Satisfaction
We are trying to maximize
Minimum should be at zero (The minimum required)
In between should be what they want/need
Maximum should be more than needed
Water Treatment
Chapter 18 introduction and Section 18.1
Water Stress
Sufficient quality and quantity of water available
Centralized Water Treatment Systems
Found in large cities
Small number of water treatment plants produce water for the city
Easier to maintain, lower costs for water
Needs large infrastructure, costs a lot
Decentralized Water Treatment Systems
More smaller plants for a city
Per smaller plant, serves small portion of city
RWH System
Schematic:
Catchment
Collection Tank
Pump
Check Valve
Prevents flowing backwards
Filter
Storage
Placement of Filter
Anywhere before UV treatment
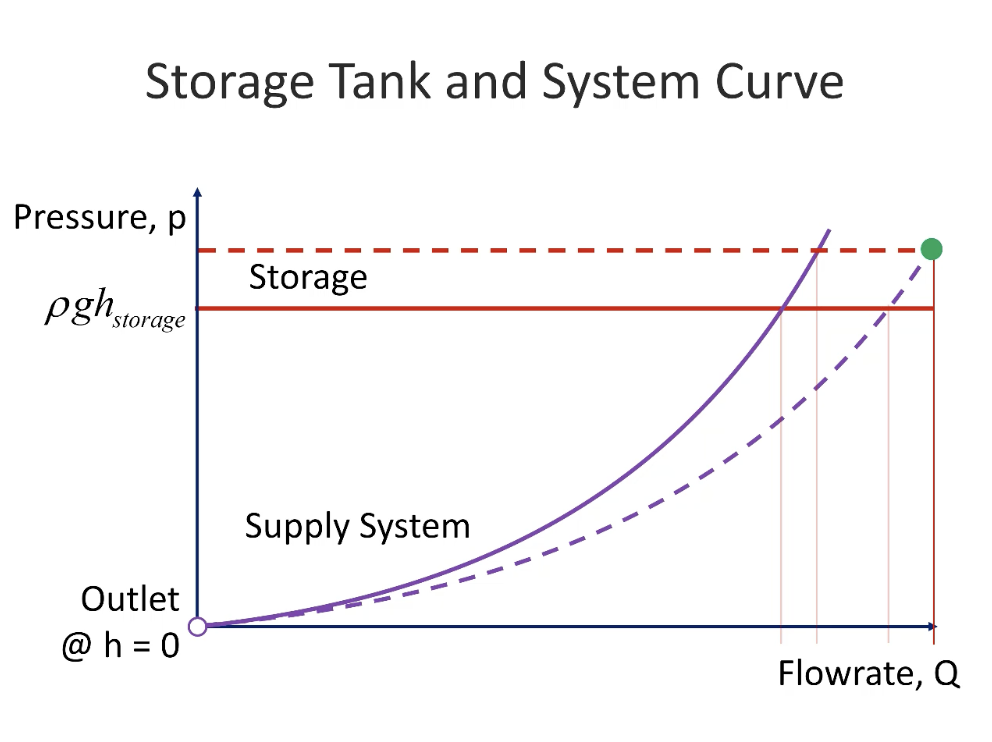
Pump Curves Graph
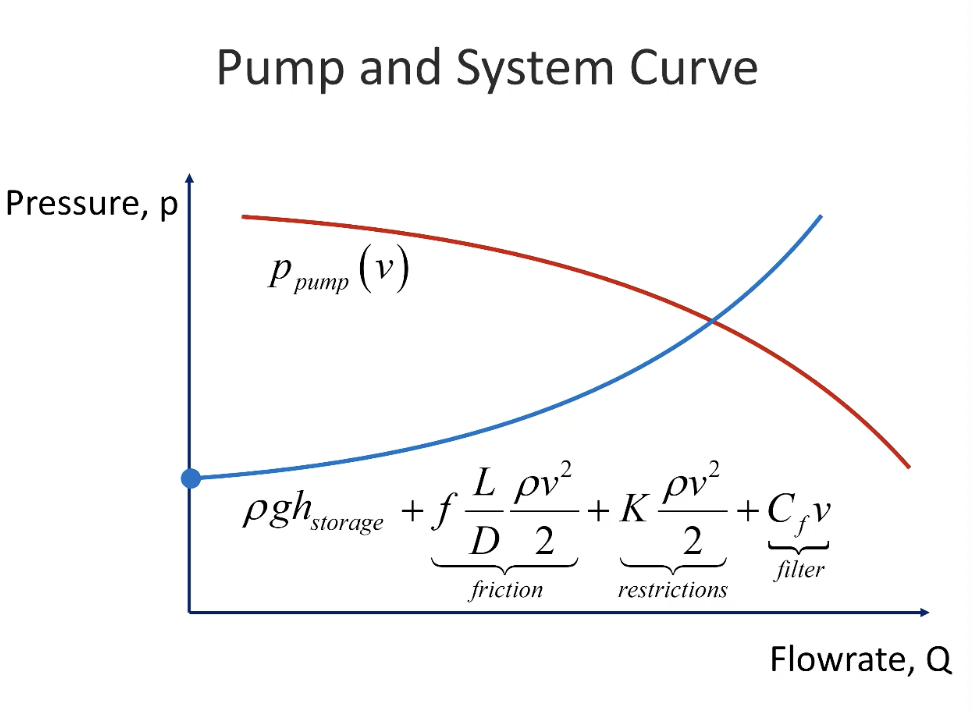 The system operates at the intersection of system and pump curve
Reducing losses, reducing height of storage tank
Vertical: Pump Pressure
Horizontal: Flowrate
System curve y int: ρgh
On-Demand Flow-Rate Graph
Graph Types
Pump Supply Pressure
Curves downwards
Line to storage tank
Upwards with positive offset (due to elevation gain)
Storage tank
Constant
Line to house
Curves upwards starting from origin
Formulas
Pressure Screencast
Pressure = ρgh, where ρ is water density, g is acceleration due to gravity, and h is height underwater.
Volume and Area don’t affect this.
Qout Formula in a Discharge Tank
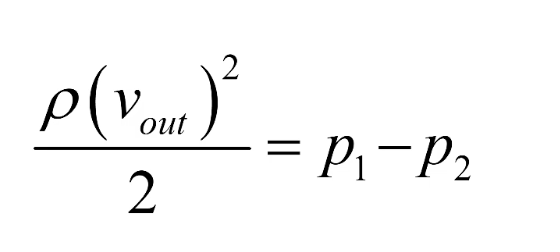
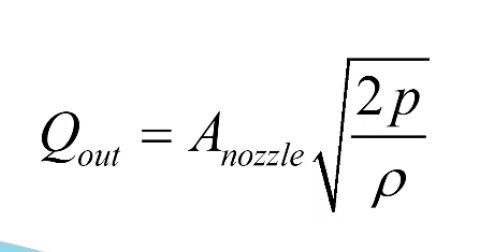 p = pressure right before the nozzle
ρ = density
Diameter doesn’t matter
Pressure Flow in Discharging Tank
Calculating Qin
Multiply the daily rainfall with the catchment area
Losses through piping
Shortens with shorter pipe
More elbows, more losses
