


Chapter 9: Kinematics
The entire goal of motion analysis is to describe, calculate, and predict where an object is, how fast it’s moving, and how much its speed is changing. In this chapter, you’ll review two separate approaches to make these predictions and descriptions: graphs and algebra.
Introduction to Motion in a Straight Line
Pretty much all motion problems can be demonstrated with a cart on a track.
The motion detector can read the location of the cart up to 50 times each second. This detector can make graphs of position or velocity versus time. The entire goal of motion analysis is to describe, calculate, and predict where the cart is, how fast it’s moving, and how much its speed is changing.
You’ll use two separate approaches to make these predictions and descriptions: graphs and algebra.
Graphical Analysis of Motion
Before you start any analysis, tell yourself which kind of graph you’re looking at. The most common mistake in studying motion graphs is to interpret a velocity-time graph as a position-time graph, or vice versa.
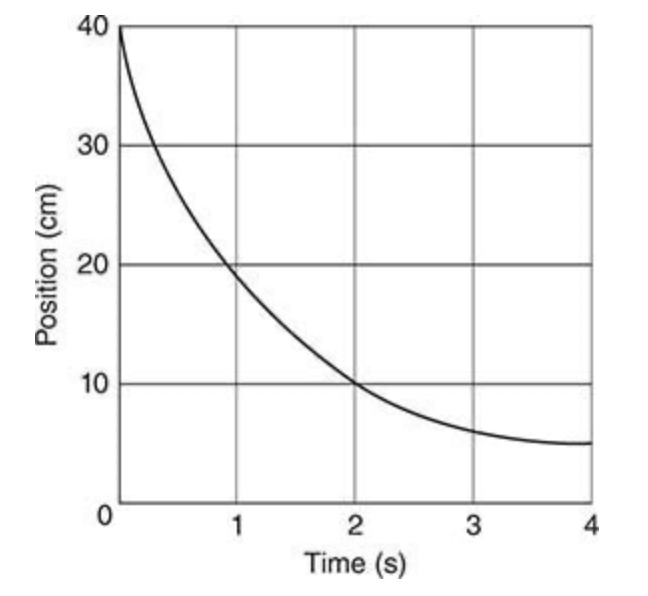
In a position-time graph, the object’s speed is the slope of the graph. The steeper the slope, the faster the object moves.
If the slope is a front slash (/), the movement is in the positive direction
If the slope is a backslash (\), the movement is in the negative direction.
For a curved line, take the slope of a tangent line.
Mathematically, this means you divide (change in y-value)/(change in x-value) to get a speed that’s a bit more than 6 cm/s.
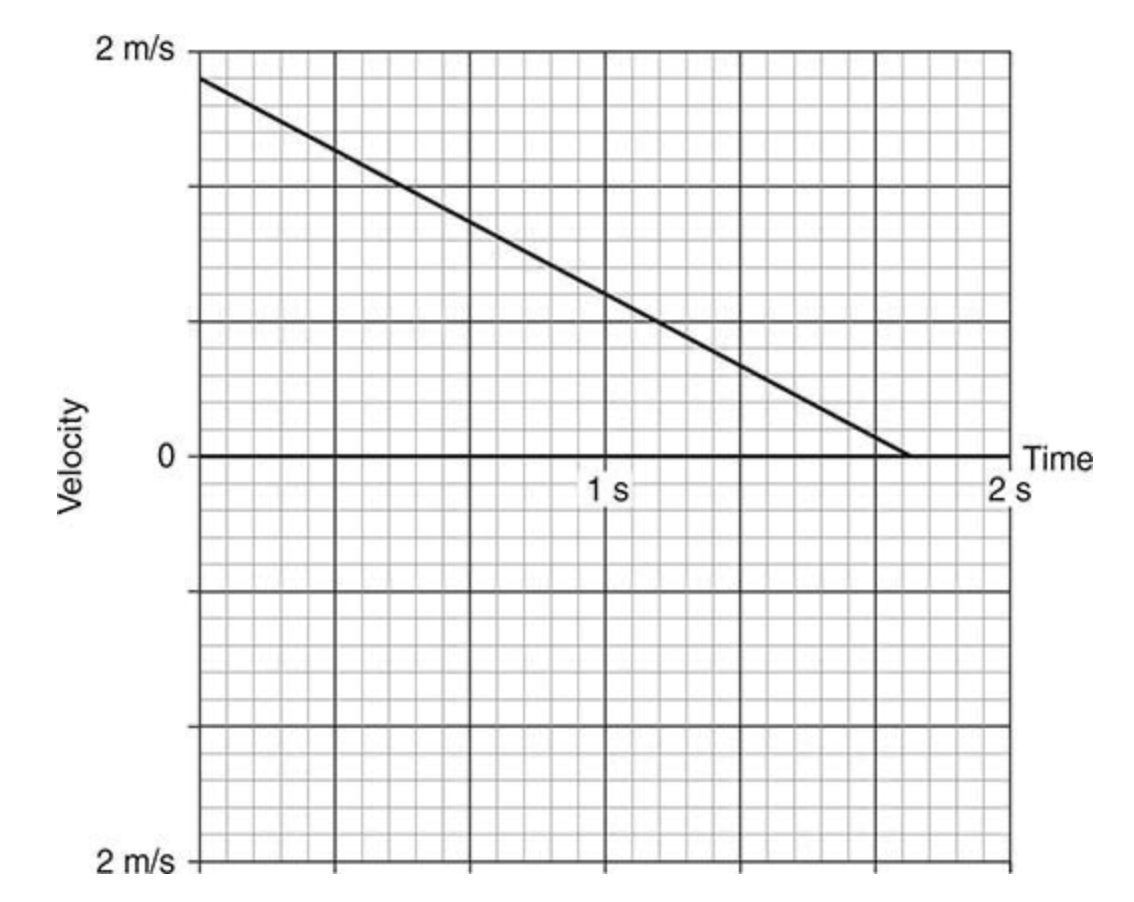
In a velocity-time graph, the object’s speed is read from the vertical axis. The direction of motion is indicated by the sign on the vertical axis.
In Example 2, at the beginning of the motion, the vertical axis reads 1.8 m/s. This means that initially, the cart was moving 1.8 m/s to the left. After 1 second, the cart was moving about 0.8 m/s. A bit less than 2 seconds into the motion, the vertical axis reads zero, so the cart stopped.
In a velocity-time graph, the object’s acceleration is the slope of the graph. You could do the rise/run calculation to find the amount of the acceleration, or you could use the definition of acceleration to see that the object lost 1 m/s of speed in 1 second, making the acceleration 1 m/s per second.3
The cart in Example 2 was slowing down and moving to the left. When an object slows down, its acceleration is opposite the direction of its motion; this cart has an acceleration to the right.
The Mistake: Acceleration is not the same thing as speed or velocity. Speed says how fast something moves; acceleration says how quickly speed changes. Acceleration doesn’t say anything about which way something is moving, unless you know whether the thing is speeding up or is slowing down.
Algebraic Analysis of Motion
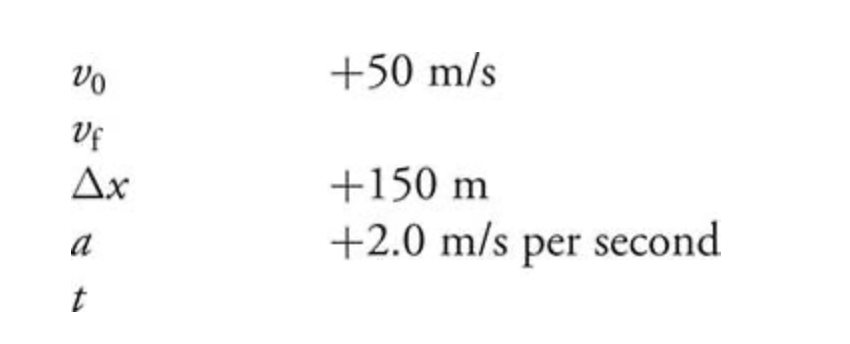
Example 3: A model rocket is launched straight upward with an initial speed of 50 m/s. It speeds up with a constant upward acceleration of 2.0 m/s per second until its engines stop at an altitude of 150 m.
Start your analysis by defining a positive direction and clearly stating the start and the end of the motion you’re considering.
For example, take the upward direction as positive,5 and consider from the launch to when the engines stop.
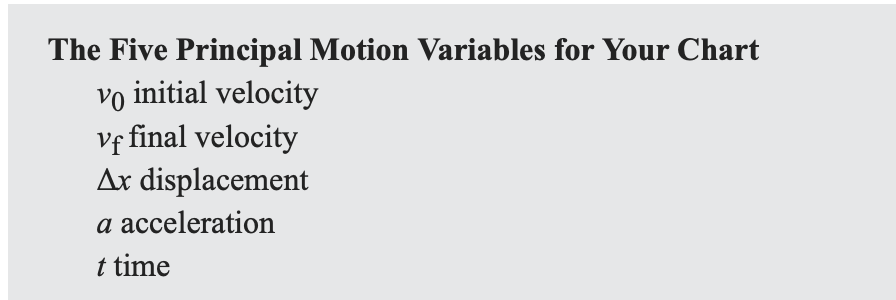
Next, make a chart giving the values of the five principal motion variables.
Include a plus or minus sign on every one.
If a variable isn’t given in the problem, leave that variable blank.
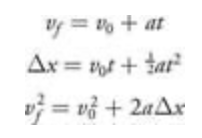
To calculate the missing values in a motion chart, use the three kinematic equations listed as follows.
Choose whichever equation works mathematically.
Never solve a quadratic equation.
If the math becomes overly complicated, try solving for a different missing variable first.

Free fall acceleration is always down.
A projectile is defined as an object in free fall. But this object doesn’t have to be moving in a straight line. What if the object were launched at an angle? Then you treat the horizontal and vertical components of its motion separately.
Example 4: A ball is shot out of a cannon pointed at an angle of 30° above the horizontal. The ball’s initial speed is 25 m/s. The ball lands on ground that is level with the cannon.
Here is what the chart would look like:

A projectile has no horizontal acceleration and so moves at constant speed horizontally
To find the vertical component of a velocity at an angle, multiply the speed by the sine of the angle.
To find the horizontal component of a velocity at an angle, multiply the speed by the cosine of the angle.
This always works, as long as the angle is measured from the horizontal.
Note that the initial vertical velocity is (25 m/s)(sin 30°) = 13 m/s. The initial horizontal velocity is (25 m/s)(cos 30°) = 22 m/s. You needed to use your calculator to get these values.
Remember that displacement only means the distance traveled start to end, regardless of what happens in between.
Well, this ball landed on “level ground.” That means that the ball ends up at the same vertical height from which it was shot; it didn’t end up any higher or lower than it started.
Thus, vertical displacement is zero.
The final vertical velocity is unknown, not zero. Sure, once the ball hits the ground it stops; but then it’s not in free fall anymore.
The “final” velocity here is the velocity in the instant before the ball hits the ground.
The horizontal and vertical motion charts for a projectile must use the same value for time.
The vertical chart is completely solvable, because three of the five variables are identified. Once the time of flight is calculated from the vertical chart, that time can be plugged into the horizontal chart, and voila, we have three of five horizontal variables identified; the chart can be completed.
What If Acceleration Isn’t Constant?
A typical Physics C kinematics question asks you to use calculus to find position, velocity, or acceleration functions. Then you can solve a motion problem even if acceleration is not constant.
The way to remember what to do is, first and foremost, to understand graphical kinematics as discussed in the section below.
Then, we know that the slope of a graph is related to the derivative of a function; the area under a graph is related to the integral of a function. Therefore:
To find velocity from a position function, take the derivative with respect to time
To find acceleration from a velocity function, also take the time derivative
To find position from a velocity function, take the integral with respect to time
To find velocity from an acceleration function, take the time integral
The force of air resistance is usually negligible in kinematics problems.