

Introduction to Business Analytics
Importance of Business Analytics
There is a strong relationship of BA with:
Profitability of businesses
Revenue of businesses
Shareholder return
BA enhances understanding of data
BA is vital for businesses to remain competitive
BA enables creation of informative reports
Areas where Analytics are often used:
NEW CUSTOMER ACQUISITION
CROSS-SELL / UP-SELL
PRICING TOLERANCE
SUPPLY OPTIMIZATION
STAFFING OPTIMIZATION
FINANCIAL FORECASTING
PRODUCT PLACEMENT
CHURN
INSURANCE RATE SETTING
FRAUD DETECTION
OLAP (online analytical processing)
Google sheets is an example of OLAP system
Type of Data
Four types of data or levels of measurement:
Nominal(Categorical)
Ordinal
The order of the values is what’s important and significant
The differences between each one is not really known, and
may or may not equal
Interval
Similar to an ordinal variable, except that the intervals between the values of the interval variable are equally spaced.
There is no true zero
Can add and subtract but no multiplication
Ratio
Ratio scales are the ultimate measurement scales because they tell us about the order, they tell us the exact value between units, AND they also have an absolute zero–which allows for a wide range of both descriptive and inferential statistics to be applied.
Ratio variables can be meaningfully added, subtracted, multiplied, divided (ratios).
What type of statistical testing does each data type use:
Nominal and Ordinal uses non-parametric testing
Interval and Ratio uses parametric testing
What type of data is each level of measurement
Nominal and Ordinal are qualitative
Interval and Ratio are quantitative
Nominal scales are used for labeling variables/classes, without any quantitative value or logical ordering.
Continuous variables-is a variable that has an infinite number of possible values.
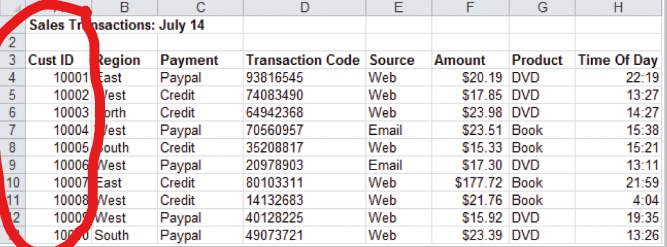
Data for Business Analytics
What is the area circled(red) in the graphic referred to as?
Entities
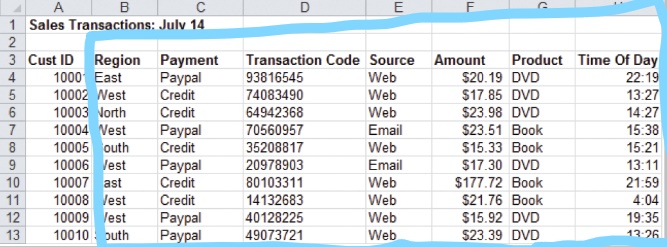
What is the area circled(blue) in the graphic referred to as?
Attributes
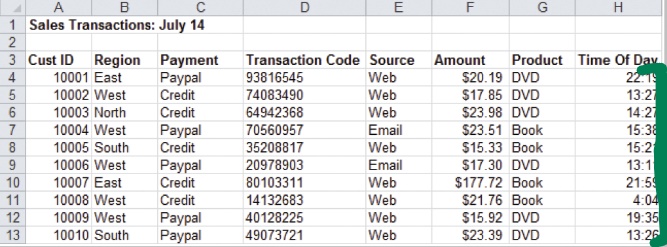
What is the area surrounded(green) in the graphic referred to as?
Records
12-Step Methodology
Define or refine the business objective
Select the data
Questions to ask:
What is available?
What is the right level of granularity?
How much data is needed?
How much history is required?
How many variables should be used?
Explore input data
Examine distributions
Study histograms
Identify extreme and missing values
Compare values with descriptions
Validate assumptions
Prepare or repair the input data
Data imperfectly describes the features of the real world.
Data might be missing or empty.
Samples might not be representative.
Numeric variables might have unusual distributions and outliers.
Data might be coded inconsistently
Transform the input data
Change counts into percentages.
Remove outliers.
Combine variables.
Replace categorical variables with some numeric function of the categorical values.
Assign missing values.
Transform using mathematical functions, such as logs.
Translate dates to durations.
Apply Analysis
Deploy the Models
Assess the Results
Compare actual results against expectations.
Compare the challenger’s results against the champion’s.
Did the model find the right people?
Did the action affect their behavior?
What are the characteristics of the customers
most affected by the intervention?
As you examine the earliest models performance, refine your business goals to get more out of the data
Type of Questions and Analytics
Descriptive
Questions:
What happened?
What’s happening?
What exactly is the problem?
What actions are needed?
Enablers
Ad hoc Reports
Dashboards
Data Warehousing
Visualization
Outcomes
Well defined business problems and opportunities
Predictive
Questions
Why is this happening?
What will happen next?
Why will it happens?
Enablers
Data Mining
Text Mining
Web/Media Mining
Forecasting
Outcomes
Accurate projections of the future states and conditions
Prescriptive
Questions
What should I do?
Why should I do it?
What’s the best that can happen?
Enablers
Optimization
Decision Modeling
Randomized Testing
Outcomes
Best possible business decisions and transactions
Business Analytics vs. Data Mining
What is a key part of effective business analytics?
Data Mining
Data Mining - is a computational process of discovering patterns in large data sets involving methods at the intersection of artificial intelligence, machine learning, statistics, and database systems.
Components of Data Mining
Customer segmentation
Predictive modeling
Association rule mining
Predictive Modeling with Machine Learning(ML)
Machine Learning(a branch of artificial intelligence)
Is the scientific study of algorithms and statistical models that computer systems use to perform a specific task without using explicit instructions, relying on learning patterns and inferences from examples instead
Supervised vs. Unsupervised Learning
Supervised learning:
Learning a function that maps an input to an output based on example input-output pairs.
Y = f(x)The goal is to approximate the mapping function so well that when you have new input data (x) that you can predict the output variables (Y) for that data.
In training data, for any input, the correct output (i.E., Class labels) are known.
Examples: decision tree, logistic regression
Unsupervised learning is a type of ML algorithms used to draw inferences from datasets consisting of input data without labeled responses.
Clustering analysis: grouping similar instances
Example applications
Customer segmentation in CRM
Parametric vs. Non-parametric Testing
Parametric - statistical test is one that makes assumptions about the parameters (variables) of the population distribution(s) from which one's data are drawn.
Non-parametric- test is one that makes no such assumptions about the parameters(variables) of the population distribution(s) from which one’s data are drawn.
Interval and ratio data are used with parametric tests such as ANOVA and the independent samples t-test in which distributions are predictable.
Nominal and ordinal data are used with non-parametric tools such as the histogram.
Descriptive Statistics
The goals when you are describing data are to
Screen for unusual sample data values
Inspect the spread and shape of continuous variables
Characterize the central tendency of the sample (e.g., Mean, SD).
Statistical Description of Data
Statistics describes a numeric set of data by its
Center
Variability
Shape
Statistics describes a categorical set of data by
Frequency, percentage or proportion of each category