frequency
number of values that fall within a given interval
interval
numerical width (ex. 50 ≤ x< 60)
modal class
class of values and intervals that appears most often
continuous variable:
has infinite possibilities in a range (ex. time)
difference between stratified and quantum sampling
The main difference is that in stratified sampling, you draw a random sample from each subgroup (probability sampling). In quota sampling you select a predetermined number or proportion of units, in a non-random manner (non-probability sampling
discrete variable:
only has particular values
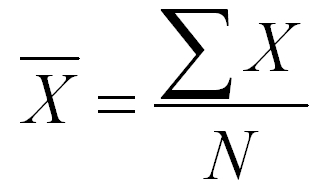
mean
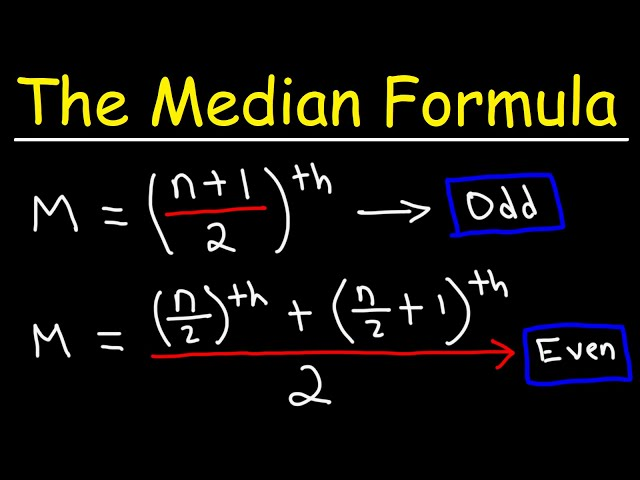
median
also the 50th percentile
mode
value with the highest frequency
cumulative frequency
when one value of the frequency is added to the sum of all the values that came before it
percentile
the score below which a certain percentage of the data lies. ex. if you score in the 95th percentile, that means 95% of other scored less than you
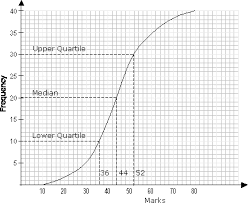
cumulative frequency graph
upper quartile:
75th percentile
lower quartile
25th percentile
interquartile range
Q3-Q1
spread/variation
how far the data ranges from the mean
range
the difference between the max and min values
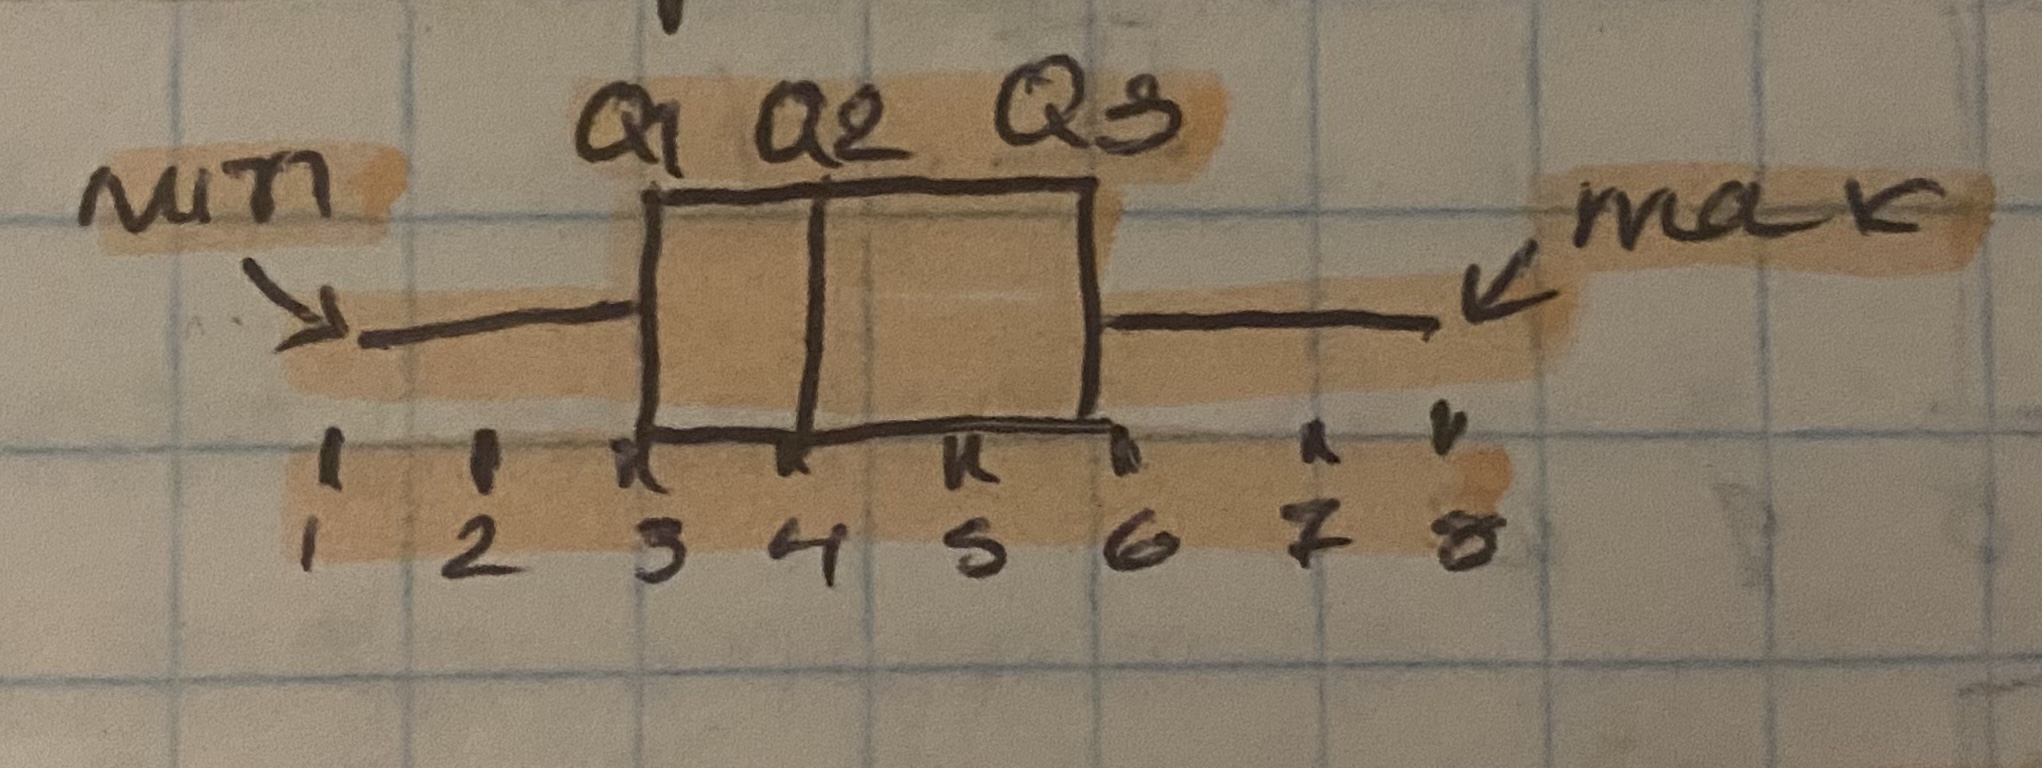
box and whisker plot
upper boundary
upper quartile +(1.5)(IQR). any data larger than this is an outlier
lower boundary
lower quartile - (1.5)(IQR). any data smaller than this is an outlier
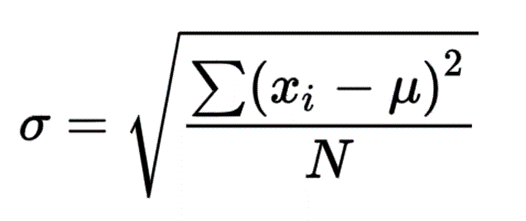
standard deviation σx
how consistent a set of values are
variance
standard deviation squared
finding σx on a calculator
stat→ edit → put the values in L1 (midpoint of each interval in L2 if using frequency) → stat → calc → 1. var stats (freq. list=L2 if using frequency) → calculate → enter
simple random sampling
everyone has an equal chance of being selected. ex. drawing names out of a hat
systematic sampling
selects members at regular intervals ex. polling every 20th customer. interval =population size / sample size
stratified sampling
sample has the same proportion from each stratum (group with commonality) as the population does, selected randomly
quota sampling
sample has the same proportion from each stratum (group with commonality) as the population does, selected specifically
cluster sampling
random selection from groups likely to be representative of the entire population instead of the whole population. ex. surveying employees from some Walmart stores instead of employees throughout the chain
multistage sampling
several levels of random sampling
voluntary sampling
members of a sample group are invited to participate
convenience sampling
members are chosen out of convenience
sampling bias
sample does not accurately represent population due to sampling technique/members chosen
non-response bias
groups are underrepresented because they chose not to respond
measurement bias
collection process affects the dependent variable. ex coercion, multiple choice survey
response bias
members give inaccurate answers
a sample has mean X and standard deviation O. if d is subtracted…
mean = X-d
standard deviation = O
variance= O²
a sample has mean X and standard deviation O. if multiplied by p…
mean =pX
standard deviation =pO
variance =p²O²
correlation
the relationship between 2 variable
correlation coefficient ( r )
measures the strength of correlation. ranges from -1 to 1
+r
positive correlation
-r
negative correlation
r=-1
perfect negative correlation
r=1
perfect positive correlation
r=0
no correlation
r is close to 1 or -1
strong positive/negative correlation
finding r on graphing calculator
stat→ x and y values in L1 and L2→ stat - calc→ 8 → calculate. make sure you switch diagnosticON by going into catalogue
line of best fit
A line that represents the trend or pattern in a scatter plot. It minimizes the distance between the data points and the line, showing the overall relationship between the variables. must pass through mean point
linear regression
method for finding line of best fit. Linear regression is used for predicting and understanding the impact of independent variables on the dependent variable. find by going to 4 instead of 8 (on graphing calculator)
x=my+c
the horizontal distance of points, found by switching the x and y columns
r2
closer to 1, the stronger the correlation