GDP
Gross domestic product
Measures the quantity of goods and services produced in an economy
rGDP
Real gross domestic product
The value of GDP adjusted for inflation
GNI
Gross National Income
NRU
Natural Rate of Unemployment
The UnE that still exists when eq real output is at full employment (Yf). It is the sum of: Structural, frictional, and seasonal.
UR%
Unemployment rate %
(# of unemployed ÷ labour force) x 100
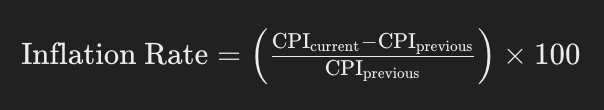
IR%
Inflation rate %
Inflation
A sustained rise in the average price level.
Unemployment
Situation when people who are willing, able and available for work are unable to find work
Deflation
A sustained fall in the average price level
Disinflation
A fall in the rate of inflation
Short run
Fixed wage period
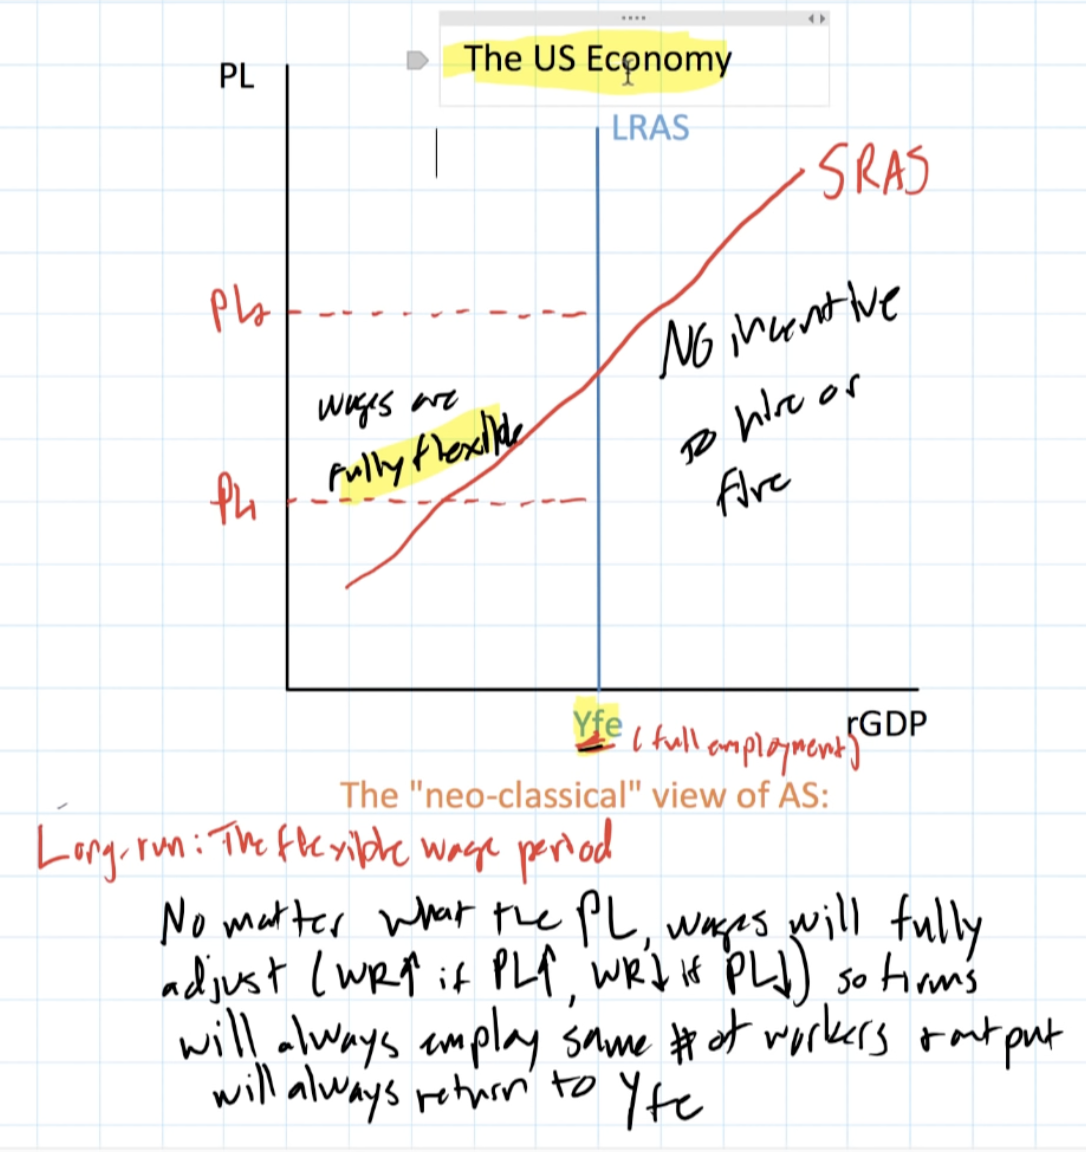
Long run
Flexible wage period
AD
Aggregate demand
The total amount of goods and services demanded in the economy at a given average price level and in a given time period. C+I+G+(X-M)
AS
Aggregate Supply
The total amount of goods and services that all industries in the economy will produce at every given price level and in a given time period.
Fiscal policy
The set of government policies relating to its receipts and expenditure.
Monetary policy
Demand side government policy to control money supply and alter interest rates
Full employment
Where increasing real Output beyond this will only result in inflation (in the LR). There is no cyclical UnE.
Economic growth
An increase in real GDP of an economy over time.
Economic expansion
an increase in the amount of goods and services produced per head of the population over a period of time
Recession
When an economy experiences two consecutive quarters of negative GDP.
CPI
Consumer Price Index
A current social and economic indicator that is constructed to measure changes over time in the general level of prices of consumer goods and services that households acquire, us or pay for consumption.
Budget deficit
when the government expenditure is larger than the government revenue
Budget surplus
when government revenues exceed total expenditures
Inflationary gap
Measures the difference between the current real GDP and the potential GDP at full employment
Recessionary gap
Occurs when a country's real GDP is lower than its GDP at full employment
Final goods
goods that have been manufactured. ready for consumption
APL
Average Price Level
Index of the average price of goods in a country over time
National economy
All economic activity taking place in a country
Cyclical/Demand deficient Unemployment
because of weak demand for various goods and services, firms decrease their output and fire workers
Frictional Unemployment
people are switching jobs
Seasonal Unemployment
people are out of job because their workplace only operates seasonally (e.g. skiing resorts)
Structural Unemployment
people are out of job because their skills are no longer required (e.g. technology improved and machinery replaced humans or consumer preferences changed and a service/good is no longer produced)
Economic Activity
Any act that generates production, income, employment or expenditure
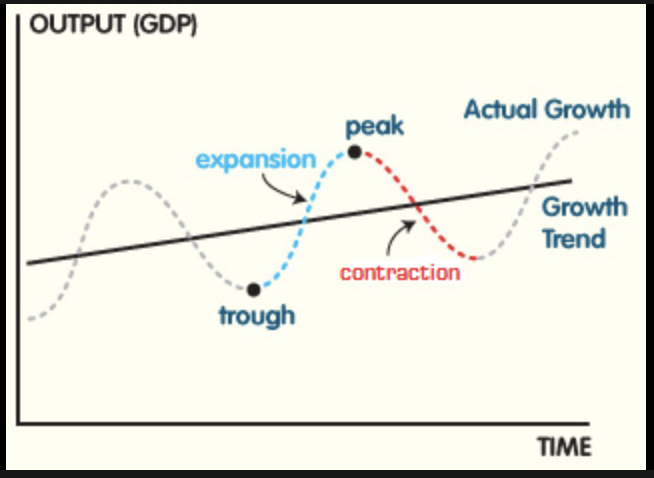
Business cycle
The aggregate of economic activity over a long period of time measured by a correlation between GDP and time.
Real wages/income
the hourly rate of pay adjusted for inflation
Nominal wages
expressed at current prices and is not adjusted for the effects of inflation
Contractionary fiscal policy
decrease in government spending and increase in taxation to reduce inflation
Expansionary fiscal policy
government aiming to increase AD – through deliberately increasing real government spending and/or lowering direct and indirect taxes, which is financed by an increase in the size of the budget (fiscal) deficit.
4-6 macro objectives
Low and stable rate of inflation
Low unemployment
Economic growth
Equity in distribution of income
Sustainable balance between imports and exports
Environmental sustainability
“real“
Taking in account of inflation, prices are put in real terms ie. Using a deflator from the base year
“Nominal”
The money value of an economic variable, before it has been adjusted for inflation
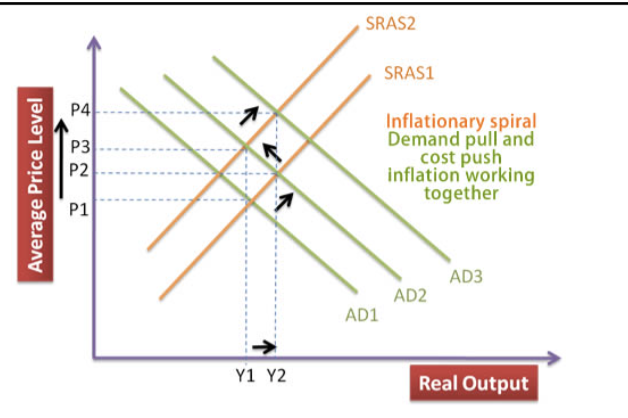
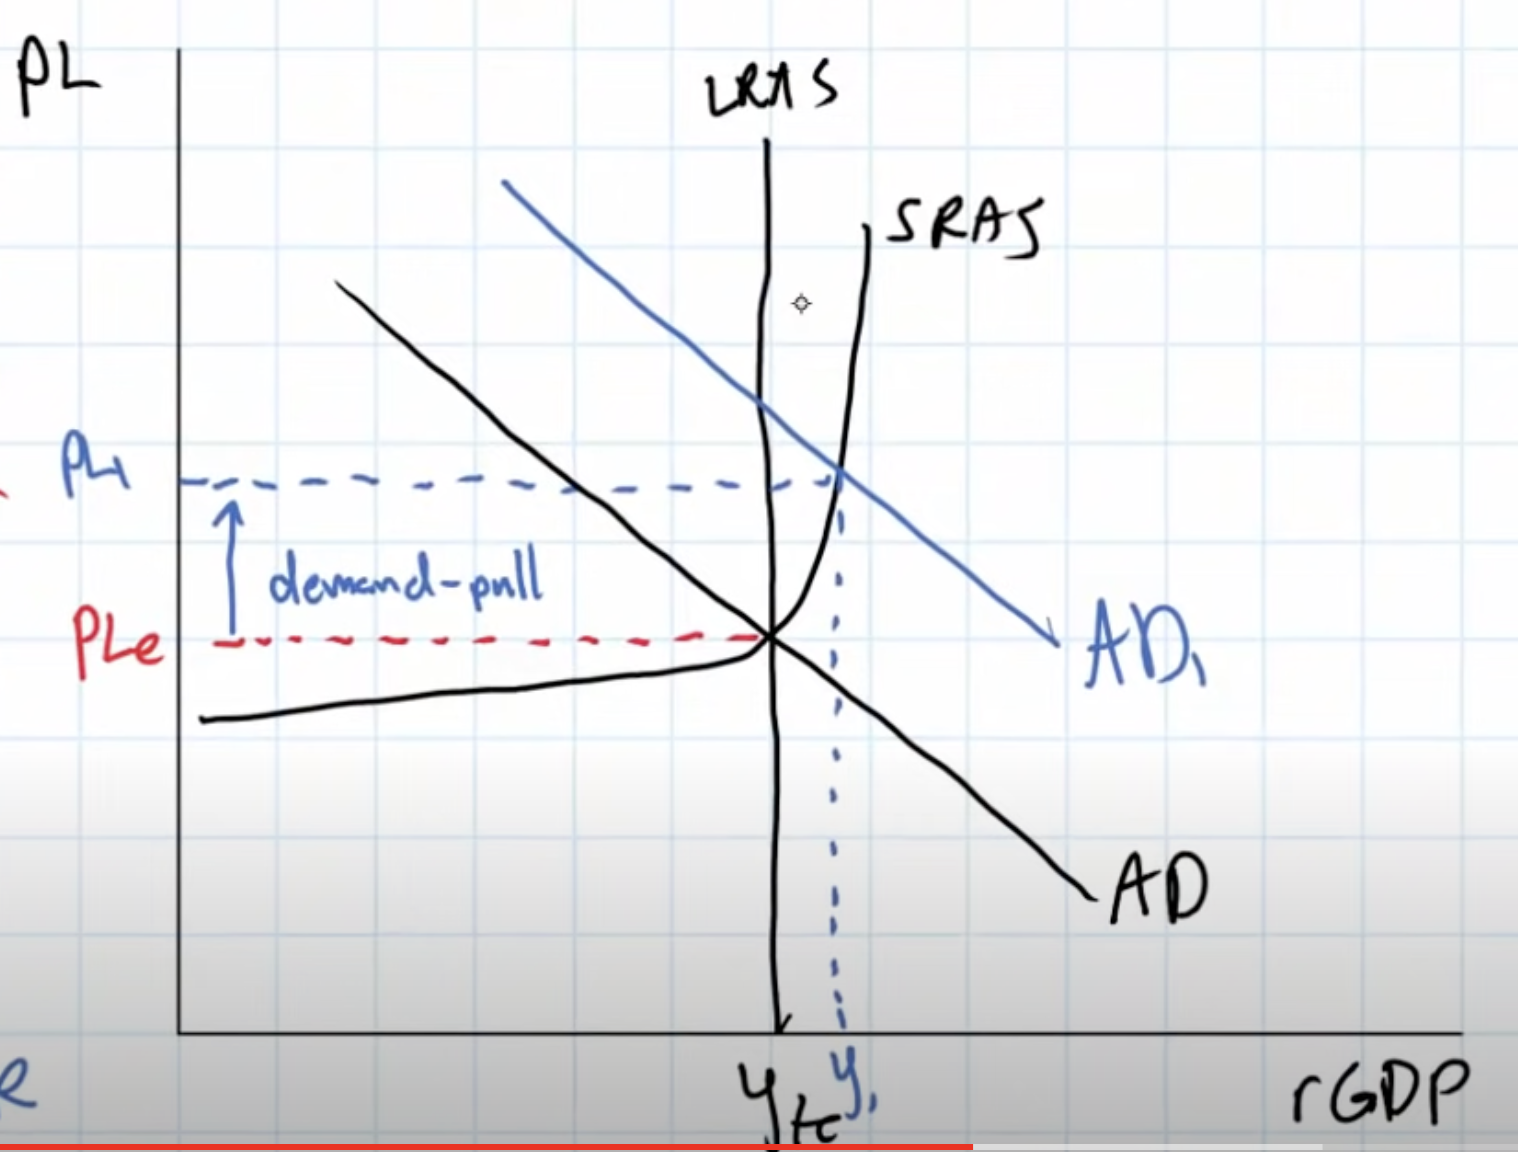
Demand-pull inflation
inflation induced by a persistence of an excess of aggregate demand in the economy over aggregate supply. AD has shifted right.
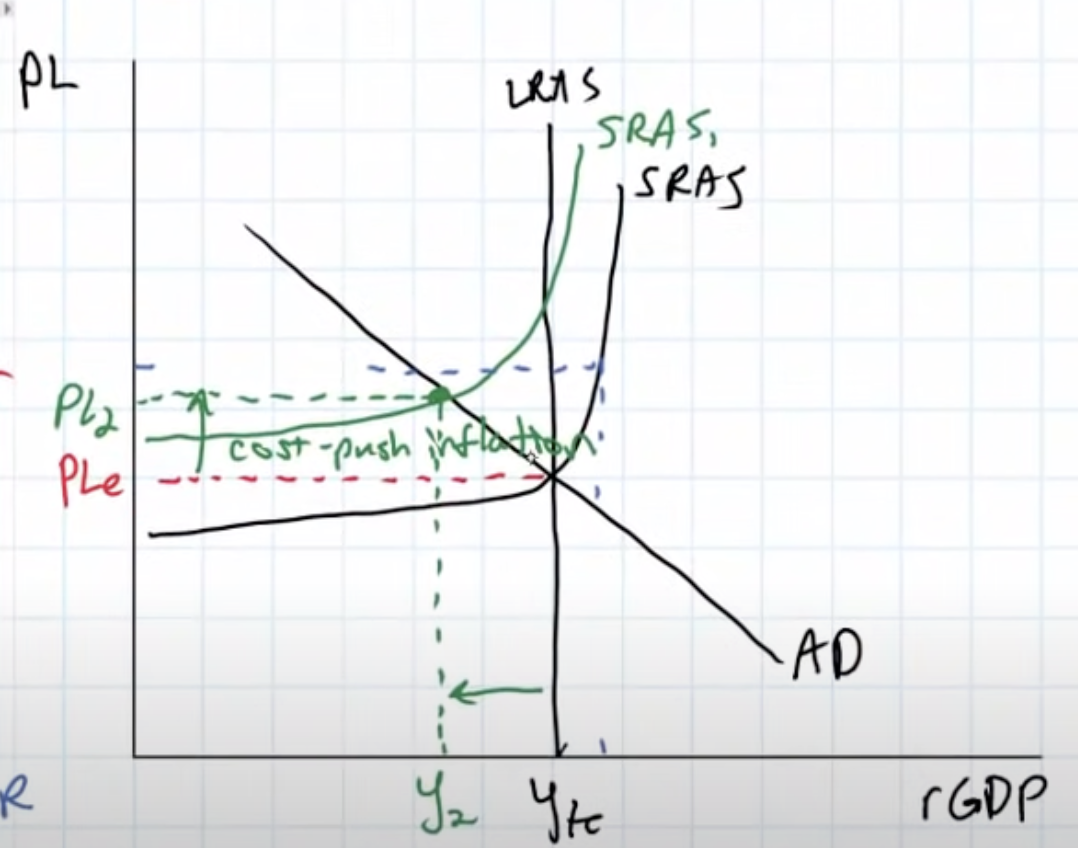
Cost-push inflation
The situation in an economy where there is sustained price rises because of production costs increasing, eg. Wages, imported materials, interest rates, rent. SRAS has shifted left
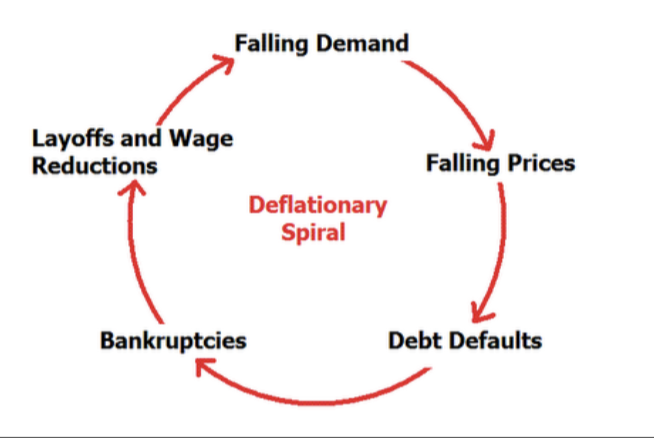
Deflationary spiral (and Diagram)
when price levels decline, leading to lower production, reduced wages, decreased demand, and continued price declines
Inflationary spiral (and Diagram)
a situation in which prices increase, then people are paid more in their jobs, which then causes the price of goods and services to increase again, and so on.
Labour force
all people who are of working age, and able and willing to work
3 Types of structural unemployment
Geographical (there is work but not within commuting distance of where they live)
Sectorial – (eg there is work in say IT but not in coal mining)
Technological – (eg labour is trained in obsolete skills eg printers, typists were replaced by machines)
GDP Deflator
Is a measure of inflation. It is used to deflate GDP to real prices. (you don’t need to know how it is calculated)
Business Cycle Diagram
Boom
Peak of business cycle, right before a recession
Recovery
Recovery is an increase in GDP from a recessionary level to match the level of output produced before the recession.
Expansion
When the economy grows beyond its previous level of output
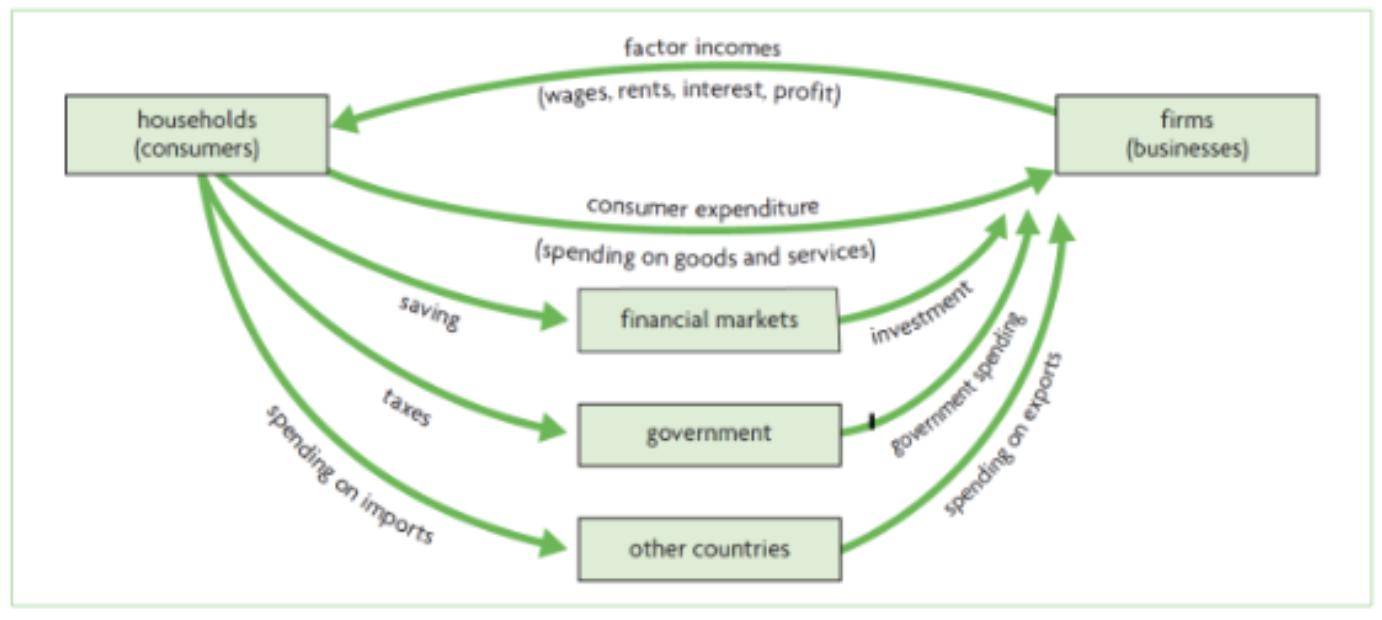
Circular flow diagram & Components
Components:
firms (businesses)
households (individuals)
Interest (rates)
is the opportunity cost of borrowing/lending money. It is the % paid buy borrowers for the use of money. Eg if a firm borrows money to buy capital it might have to pay the lender 5% a year.
Leakages/Withdrawals
Money that doesn’t re-enter the economy in terms of circular flow (i.e. non-consumption uses: savings, taxes, imports)
Surplus
The oversupply of a good
Debt
An amount of money owed by a person, firm or government (the borrower) to a lender
Regressive tax
Requires the poor and middle class to pay a larger proportion of their income in taxes than the rich
Productivity
Ratio between the output volume and the volume of inputs. In other words, it measures how efficiently production inputs, such as labour and capital, are being used in an economy to produce a given level of output.
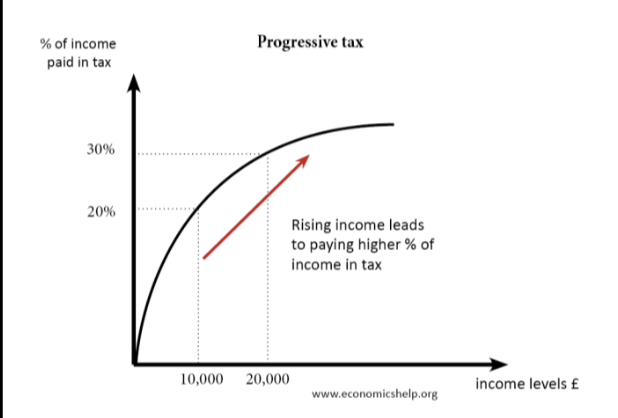
Progressive tax (diagram)
higher tax on higher incomes
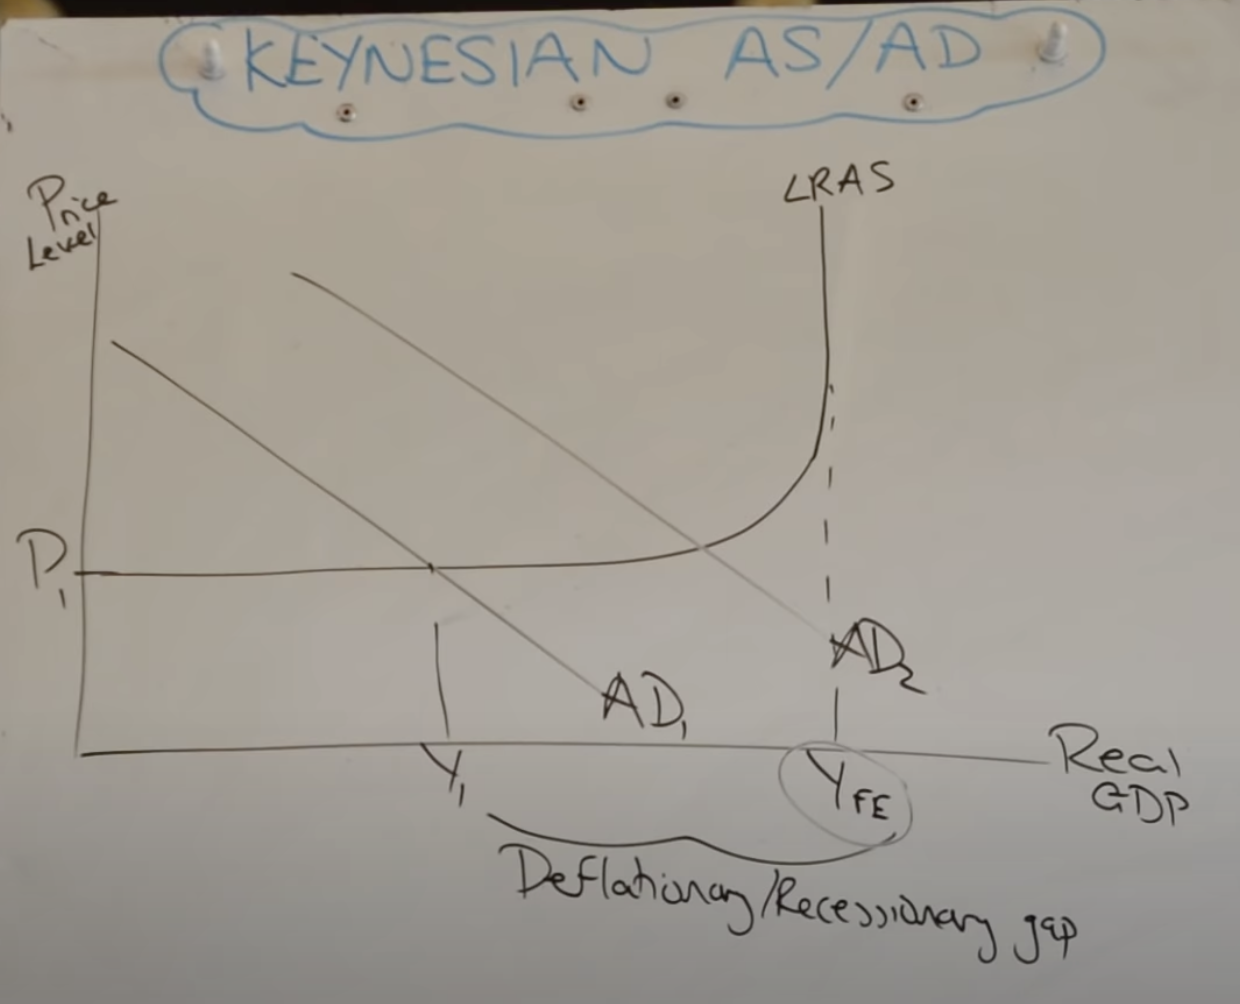
Keynesian AD/AS
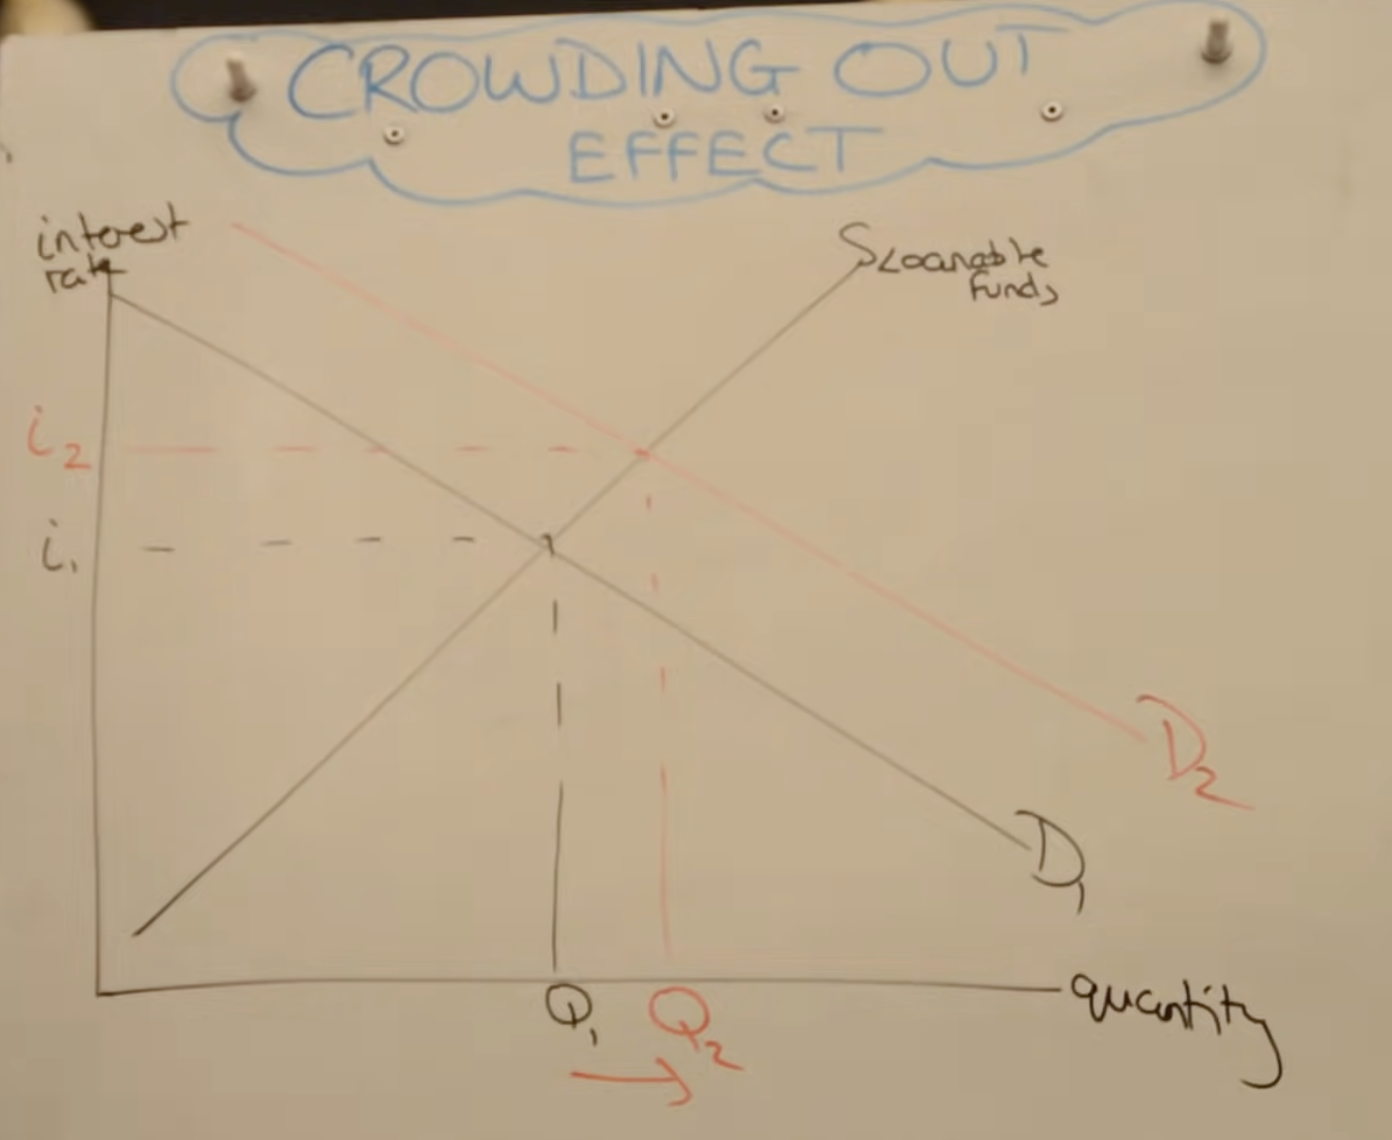
Crowding out
PPC
good 1, good 2
demand pull inflation
cost push inflation
neo classical ad/as