Tags & Description
what is a place?
an area/location that doesn’t necessarily have definite boundaries. It is dynamic and shaped by internal and external connections. A place contains meaning at an individual, social or cultural level.
Birth Rate
the number of live births per 1,000 people, per year
Mortality/Death Rate
the number of deaths per 1,000 people, per year
General fertility rate
the number of live births per 1,000 women between the ages of 15 and 44
total fertility rate
average number of children born to a woman during her lifetime
immigration
people coming into the country to stay
emigration
people moving out of the country to live elsewhere
net migration
the difference between immigration and emigration
natural change
the outcome of the balance between births and deaths. Natural increase occurs when births exceed deaths and natural decrease occurs when deaths exceed births.
4B.1 A In the last 50 years what have been the recent population changes in the UK? what two forces have contributed to these changes? what is this different/redistribution called?
population growth very much concentrated in England- especially in the South
in comparison, much of the North of England experienced relatively little growth. there was a sustained population decline in some parts. these changes rose from:
The rising economic prosperity of London and the South East as a global centre of finance and business, as well as a hub of modern service industries.
The decline of the manufacturing industry in its former strongholds in the Midlands and the North of England. The collapse of traditional heavy industries in the North East, such as coal mining, iron and steel making, shipbuilding and chemicals, in the face of foreign competition -the region is still slowly recovering.
The redistribution of population resulting from this spatial pattern of growth and decline is often referred to as the North-South drift or divide.
Reasons for rapid population growth in the South East but slow population growth in the North East and Wales
stats for percentage increase from 2001-2011 census
Rapid population growth in the South East 7.9% and London 14.0% | Slow population growth in the North East 3.2% and Wales. |
physical location of the southeast makes it easier to access from continental Europe via coastal ports e.g. Dover, Transport links like. HS1 and HS2, Westminster is located in London> | loss of heavy industrial activity - north is more dependant on public sector jobs (18.9% compared to everywhere else 15.7%) > |
this increases trade between SE UK and the EU > | this means that NE is a less desirable place as there are fewer job opportunities available and likely some unemployed> |
this means businesses are attracted to SE UK as are people because the jobs are more likely to be paying higher if they are doing well and there are more job opportunities.- 794 businesses per 10,000 adults in north compared to 1058 in south | loss of population because of outward internal migration to the SE occurs. |
Bigger populations in SE> multiplier effect> increased investment> more attractive to live there.- Average housing prices are 3.5x what it is in the north - Commuter towns and transport links for travelling to London - Internal migration form south to north for better prospects and things to do - Bottom north west brings in retired people | fewer people in NE> loss of services> loss of investment> spiral of decline.- Transport in the north spends a tenth of national average |
population density
The number of people per unit area (usually per km2); i.e, the total population of a given area (country, region or city) divided by its area.
demographic
Of or relating to some aspect of a population, for example its size, rate of change, density and composition.
4B.1 B How does the distribution of population vary in the UK?
England accommodates over three-quarters of the population on just over half of the total area. This results in a high average density of 406.5 persons per km2.
Scotland’s share of the total population is a mere 8.4 per cent, but this is spread over nearly one-third of the UK’s total area. As a consequence, the population density is a mere 67.3 persons per km2.
The populations of Wales and Northern Ireland are even smaller, but so too are their shares of the total area. Their population densities are a modest 149 and 130 persons per km2, respectively.
-the countries of the UK do not have populations that are strictly proportional to their shares of the total land area
-as a consequence, population density varies considerably from country to country.
what are the main drivers of population change in the UK since 1992?
- Net increase migration change
- 2004 - more EU A8 countries (eg Poland joined)
- Migration declined in 2008 during the financial crisis
- As migration increases, births increase as well
why is net migration driven by non EU nationals?
- More people coming back due to Covid and not wanting to be away from family
- People leave the UK from the EU (doctors, nurses, EU)
- Lots of international students coming in as they pay lots of school fees which subsidised fees of locals
UK population growth stats
• Post world war 2 baby boom would be around 70 now
• Swinging 60s - less strict or traditional attitude towards things such as the contraception
• Mid 1970s (73-75) recession so less babies being born
• In migration of 20-30 yrs old after 2004 EU enlargement A8, more people of a younger generation migrating
In 2014 -27% of all births were to non UK born mothers
2020:
population - 67,081,000
world population rank 21st
population growth rate 0.6%
life expectancy 81.65 yrs
birth rate 11.377/1000
death rate 9.3/1000
fertility rate 1.65
growth rate of economy in North England vs the rest
average growth of the economy 1997-2012 for the North is 3.8% and rest of England is 4.3%
London’s high population growth rate resulted from its expanding knowledge economy, which has led to an influx of highly qualified workers and their families. Meanwhile – in comparison – in the North East, a slower population growth rate has resulted from the continued collapse of its traditional industries (coal mining, steel manufacture, engineering, shipbuilding), which has led many workers to leave the region with their families to find work elsewhere.
What causes a change in population? - lots of reasons!
increase in artificial contraception
emancipation of women
legal age of marriage increases
war
education made compulsory
frequent natural disasters
mass vaccination programmes
GDP is relatively low
food supplies are unreliable
civil conflict
welfare state
better healthcare system
Roman Catholic Church is influential
easy availability of a wide range of food
high standard of education
provision of clean water
availability of media
pro-natalist policy
high taxes
economic recession
climate extremes
political instability or austerity
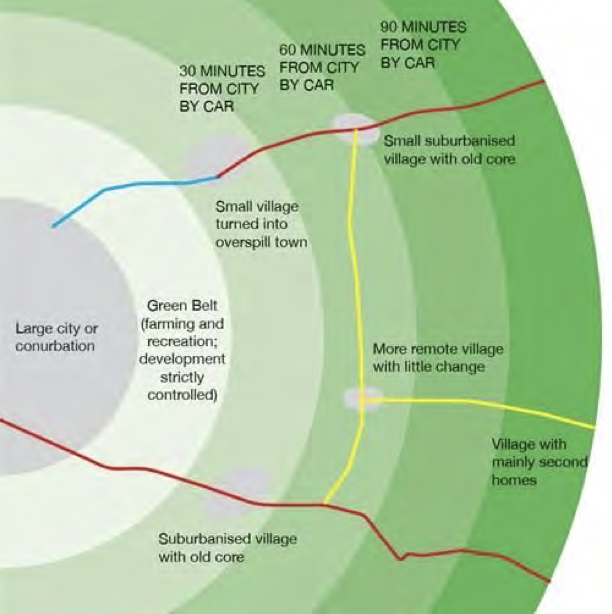
what is the rural-urban continuum
geographic model, created by Cloke 1979
shows a pattern of how house settlements change
the unbroken transition from sparsely populated or unpopulated remote rural places to densely populated, intensely urban places.
population density of the cbd (central business district)
low density due to a lack of housing- mainly offices or historical sites from the old town centre, commercial uses or public buildings
the housing available will likely be extremely expensive due to the peak land value intersection (plvi) and this would likely be flats or studios.
population density of the inner city
Very high density - densely packed terraced housing, high-rise flats, high-density social housing
population density of the suburbs
Lower density - due to low density interwar housing - mainly semi-detached, gardens, driveways- houses will be more spaced out - probably homes to families.
population density or the urban rural fringe
becoming higher density - the greenbelt is established at the edge of a city (to stop urban sprawl) so housing developments are forced to become high-density. Areas of greenfield are becoming in-filled as the government looks for more areas to build and house builders look to maximise profit by building in areas of high demand.
population densities of Scotland
Much of Scotland's population is concentrated in the Central Lowlands, particularly in the cities of Edinburgh and Glasgow and, to a lesser degree, along part of the east coast. Large areas of the country — the Highlands, Western Isles and the Southern Uplands — have a population density of less than 25 persons per km2 (one-tenth of the UK average).
What do the small peaks along the continuum coincide with?
commuter towns
population density past the urban fringe cliff
densities fall rapidly due to:
planning controls
location of large estates of social housing
creation of green belts and protected sites.
larger houses with larger properties
What is the population density profile affected by? x 5
- physical environment
-socio-economic status
-dwelling type+household size
-functions
-planning
physical environment
Fairly flat areas lend themselves to development (flood plains and steep slopes are expensive to build on) - historically, spread of urban areas, tended to finger outwards along low lying corridors
socio-economic status
More wealthy members of society will live in nicer and more expensive housing - typically areas of low population density - also people will wish to be far away from various forms of pollution - therefore richer people tend to live west of the city, as the wind will blow it the other way- it collects and drifts over the leeward side.
dwelling type and household size
dwelling unit impacts population density, e.g. high incidence of flats leads to high population density - household size will also have an impact (e.g. multiple generations together)
functions
distribution of non-residential activities has direct and indirect impacts on population density - it will be directly lowered when housing is intermixed with non-residential activities - location of manufacturing can have a negative impact on the quality of life of local residents, and therefore is an indirect factor - but these areas are likely to be occupied by high density, cheap housing
planning
Impacted by green belt, but planners also control the density of all new residential development - planning consent will stipulate how many units should be built per hectare
define population structure
the composition (make up) of the population of a particular country, region or area. This can include the different age groups, genders, life expectancy, family size and marital status of a given population.
Age and gender are particularly significant, and these are best shown on population pyramids.
what is a population pyramid? how does it work?
The population pyramid is in effect a histogram, constructed in one-, five- or ten-year age groups, with males on one side, females on the other. The base of the pyramid represents the youngest age group and the apex the oldest. The detailed shape of a population pyramid can tell us much about what has happened to the population over the last 75 or more years. It can also provide some pointers as to how the population is likely to change in the foreseeable future.
The Office for National Statistics (ONS) projects the population will...
increase by 6.6 million people (9.9%) between 2021 and 2036.
• This includes a net migration of 6.1 million people and about 500,000 more births than deaths.
• The figures say there could be an additional one million people aged 85 and over in the UK by 2036.
• By 2036, the size of the UK population aged 85 years and over is projected to increase from 1.6 million (2.5% of the total population) to 2.6 million (3.5%).
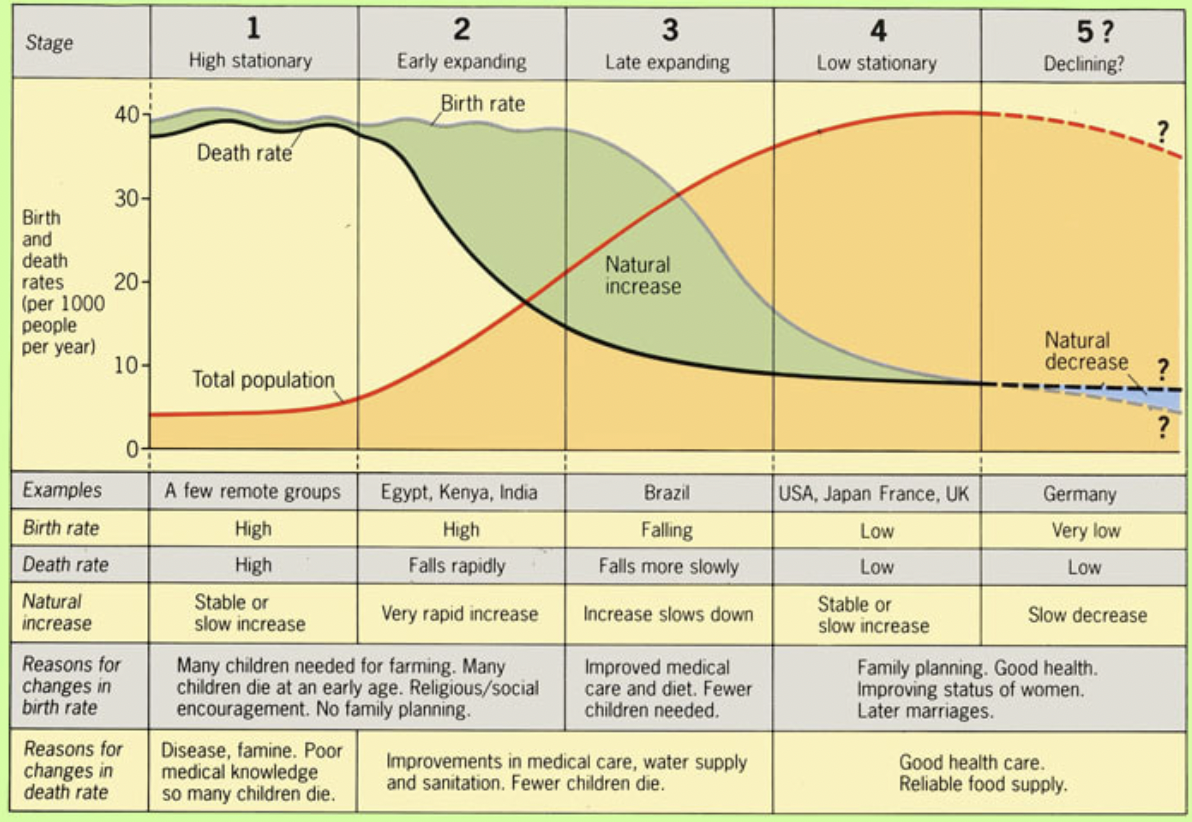
what is the demographic transition model? what are the different stages?
A model representing changing rates of fertility and mortality over time, their changing balances and their net effect on rates of population growth.
stage one- Low Growth: A pre-industrial agrarian society with a High BR, High DR, and a Zero NI
stage two- High Growth, High BR, Rapidly declining DR, High NI
stage three- Moderate Growth, Rapidly Declining BR, Moderately Declining DR, Moderate NI
stage four- Low BR, Low DR, Low NI, stable population
stage five- Low BR, Increasing DR, Negative NI, decreasing population
what are the different types of internal migration? x 7 + explain them + define internal migration
The movement of population within a country
• Student migration
• Rural-urban migration
• Retirement migration (eg Bournemouth)
• Counter-urbanisation (when large numbers of people move from urban areas into surrounding countryside or rural areas.)
• Suburbanisation (less crime, less air pollution, bigger housing- where the suburbs in the outer edge of the settlement grow outwards as new housed and services are built to accommodate more people)
• Re-urbanisation (when people move back into inner city areas where population had previously declined due to a range of social, economic and environmental issues)
• Regional North South migration
what are cultural characteristics?
features of an area (and people living there) in terms of their beliefs, knowledge, dress, food and habits etc
what factors affect cultural characteristics? x 8
- Income
- Ethnic background
- Fertility rate
- Mortality rate
- Recreation facilities
- Housing standards
- Education
- Migration
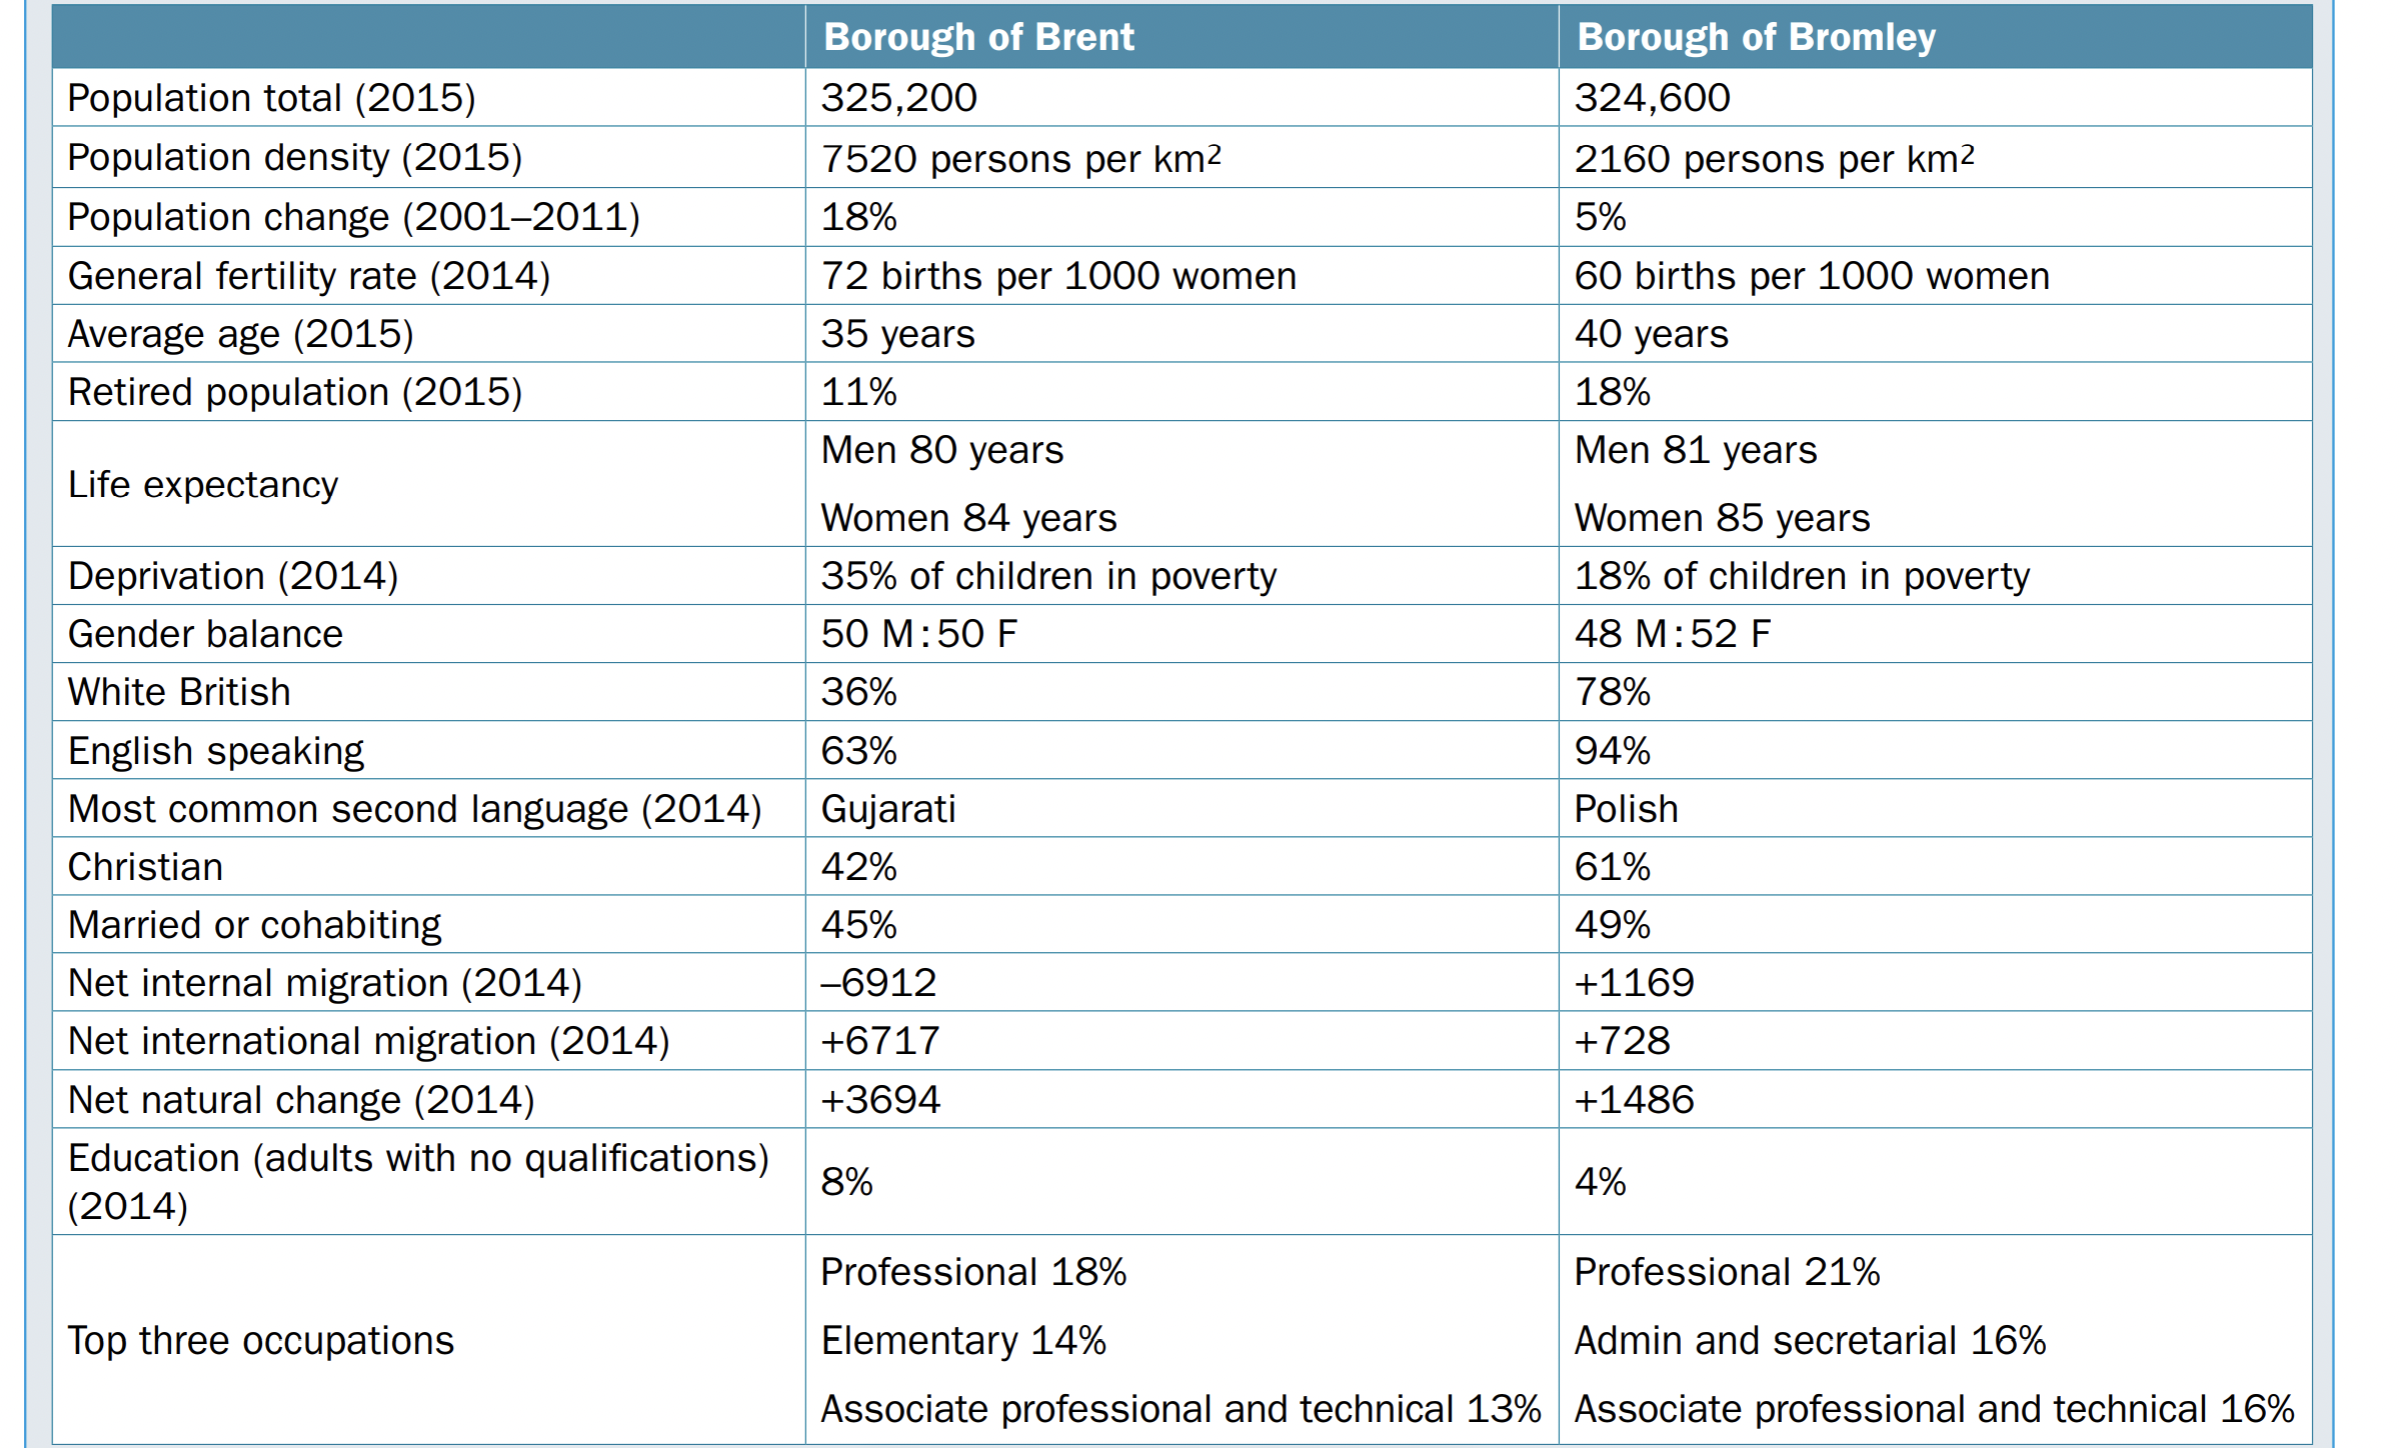
Brent Vs Bromley stats
The borough of Brent lies midway in a NNW direction between the centre and the fringe of Greater London. The borough of Bromley straddles the southeastern margins of Greater London (Figure 19.12). Housing in Brent mainly dates from the late nineteenth and the early twentieth century. Terrace and semidetached dwellings prevail, many being subdivided into flats. In contrast, most of the housing in Bromley dates from the inter- and post-war years and is either detached or semidetached.
The most striking differences between the two boroughs are:
Population density: Brent is over three times more densely populated than Bromley. Such a remarkably high density is achieved by small dwelling units and by the subdivision of these units into flats. The flats are occupied by a mix of single people, cohabiting couples and families with children. Living at high densities is one way of bringing housing costs in this part of the capital more into line with earnings.
Rate of recent population change: The rate of change in Brent was over three times that of Bromley. The higher rate is partly explained by the slightly younger population and the influx of immigrant families.
Migration: Brent shows an interesting contrast of a substantial inward international migration and a strong outward internal migration. In Bromley there were relatively small inward internal and international flows.
Ethnicity: Brent has a remarkably high level of ethnicity; immigrant families are prepared to live at high densities and their fertility rates are relatively high. High levels of ethnicity also help to explain the cultural differences in the borough (religion and language).
Gender: Little difference, but higher female life expectancy is part of the explanation in Bromley.
Age structure: The indicators (average age and percentage elderly) are that the Brent population is a younger one.
Marital status: Very little difference between the boroughs.
Education: Single measures suggests a slightly higher level of educational attainment in Bromley.
social clustering definition
when ethnic groups are concentrated in specific areas
ethnicity definition
cultural heritage shared by a group of people that sets them apart from others
ethnic enclave
concentration of particular communities in an area
Factors affecting levels of diversity x 4
Physical, social clustering, government policy, accessibility to key cities
Physical factors affecting diversity
isolated areas eg mountainous - low levels cultural diversity eg Welsh valleys, Scottish highlands
Social clustering affecting diversity
- First offered safety in numbers to protect from racism + maintain culture
- specialised shops, restaurants, facilities, places of worship set up eg Mandir so large Indian community in Wembley/kingsbury
- cost of housing can lead to clustering - people of similar social-economic status or ethnic minorities
Gov policy
- end of WW2 - Labour shortages in textile factories + NHS - gov sponsored job ads overseas - Black Afro-Caribbean people migrated - most settled in Brixton, Tottenham, Notting Hill
- British nationality act 1948 - citizens of any colonies could settle in UK
Accessibility to key cities
- unlikely to arrive with jobs - cities good access to wear work likely to be found - potential consumers
Cultural change
Modification of society through innovation, invention, discovery or contact with other societies
Boston, Lincolnshire case study -where are the migrants from?
- Eastern Europe - 10.6% of towns population of 65,000 comes from countries such as Poland, Latvia, Romania after they joined EU in 2004
Boston - change in cultural characteristics
- rise in proportion of shops eg newsagents, hairdressers - run or staffed by immigrants - loss of "traditional English businesses" eg butchers, grocers
- rise in non-English speaking people - schools have to accommodate
- higher concentration of young people - increase in BR - demand for services eg schools,maternity wards
issue of us and them attitude
Issues related to multicultural societies
- lack of integration - "us and them" mentality- can lead to some mutual hostility
- discrimination against ethnic minorities in local authority housing
- language barriers to education, employment
Cultural identity
Feeling of belonging to a group - relates to nationality, ethnicity, religion etc
Aboriginal People in Australia - cultural changes
- Loss of cultural identity causing rising Indigenous youth suicide rates according to elders
- main issue = drugs + alcohol
- Aboriginal men 4x + Aboriginal women 5x more likely to commit suicide than non-Aboriginal
Aboriginal people in Australia - demographic changes
2016 - ~ 798,000, median age 20.3, median age non-indigenous 37.8
2021 - ~983,000, median age 24
Tower Hamlets - cultural changes
Increasing ethnic inequality - ranked worst district in England + Wales for Asian inequality - housing inequality particularly bad
2011 - 32% Bangladeshi, 31% White British
Newham, London
- since 2000 - very high fertility rate - 25% increase in population size
- only 6.7% over. 65
- between 2001-2011 - pop of non-Uk born citizens rose by ~72,000 - now accounts for 55% of borough
Who influences characteristics of places? x 4
Regional, national, international, global influences
Regional + national influences on pop characteristics
- varying economic wealth within countries eg N/S countries
- national decisions on encouraging/restricting migration
- gov planning eg greenbelt can affect demand for housing
- internal migration
- second homes/retirement homes in rural areas - shutdown to services
International + global influences
- ethnic diversity/enclaves
- global inequality influencing migration
- war + terrorism - refugees, asylum seekers
Centripetal force
Something that unifies people + enhances support of area
Centrifugal force
Attitudes that tend to divide the population - physical features limiting interactions, human made concepts of religion, culture, economic activities
Regional + national Influences on Frognal + Fitzjohns
Regional + or national - desirable area with expensive house prices, Hampstead Heath, good transport links, lots of educational establishments
International + global influences on frognal + fitzjohns
The Finchley Road is full of TNCs , international migration relatively high
Frognal + Fitzjohns general pop structure
49% male, 51% female
Pop density - 87/hectare
Mean age 39.2
% good health - 91.7%
Frognal + Fitzjohns diversity
Born in England - 48.7%
% White - 65.3% (lower than national avg)
% Asian/Asian British - 20.2% - (higher)
% Black/African/Caribbean/Black British 2.1% (lower)
Frognal + Fitzjohns economic + housing
5.7% no formal qualifications
% whole house owner - 5.2% (much lower than National avg)
%flat/maisonette/appartment - 94.8% (much higher)
% rented/social - 68.6% (higher)
Index of Multiple Deprivation (IMD)
- measure of relative deprivation for small areas in England
- from 1 (most) to 32,844 (least)
- combines indices from 7 domains - income, employment,education , health, crime,barriers to housing + services, living environment
Perception of Victorian London - 1837-1901
- Industrial Revolution - rural-urban - pop rose from 1-6mill
- dirty, unhygienic, cramped, dangerous, diseases, poor working conditions
- extreme inequality
- improvements: sewage system, met police founded, new homes, West End, Regent's Street
Positive perceptions of London today
- jobs - higher wages
-culture, diversity
- entertainment + social activities
- good transport links
Negative perceptions of /issues with London today
- air pollution - everywhere at moderate/unhealthy for sensitive groups level
-cost of living - houses, commuting, food
- high crime rate
- social isolation - elderly
- fast paced + stressful
- substandard housing
Life cycle
- based on idea that most households go through a sequence of changes in their life - changes in housing needs
- can differ between low/high income families - expense may leave no choice or moving
Rural Idyll
- attractive landscape, quiet, no pollution, friendly, safe
Hardy's "Wessex"
Thomas Hardy (1840-1928) - novelist - purveyor of rural idyll - "Wessex Novels"
Perpetuates rural idyll - also reminds of harshness + isolation of countryside
Different types of rural
Rural-urban fringe
Commuter belt
Accessible rural
Remote rural
Rural statistics 2020
~ 9.7mill in rural areas in England, ~46.9 mill in urban
65+ = 25% of rural population, 17% of urban population
White ethnic group = 96.8% of rural pop
Commuter belt
- eg Hurstpierpoint : 1hr to London victoria, 17min to Brighton
- these places experiencing fast pop growth - workers wanting to avoid negative aspects of cities eg expensive housing
- lots of young adults - high natural increase
Accessible rural
- eg Hawkshead
-beyond reach of easy commuting - main attraction for single day-trip for urban dwellers
-predominantly white British - large elderly population
Remote rural
- eg welsh valleys, Scottish highlands
- suffers from de-population and subsequent decline
- out-migration due to isolation, lack of opportunity
Remote rural issues
- isolation - difficult to socialise
- irregular transport
- lack of opportunities except in primary sector
- schools + services shut down
- +400,000 fewer ppl age 15-29 in rural communities than in 1990
- 2nd home owners - increase property price + cause services to decline - locals driven out - eg Gunnerside - 40/60 properties 2nd home
Potential recovery for rural areas
- tourism - "adventure" and remoteness for urban dwellers
- counter-urbanisation made possible by tech + communication - increase in pop - positive multiplier effect
Remote rural spiral of decline
- ppl leave for better opportunities in urban areas - employers find it hard to recruit labour - shops close + services decline - less money, fewer jobs, fewer people - reduced investment + business close - people become aware of decline + lower QoL