What is data?
Information about individuals or subjects in a population
What is a variable?
Any characteristic, numerical value, or quantity that can be measured or counted
What are two examples of variables?
Eye colour, height
What are the different types of data?
Qualitative (categorical) and quantitative (numerical)
What are the two types of quantitative/numerical data?
Discrete and continuous data
What is discrete data?
Countable data that only results in whole numbers
What is continuous data?
Ranges of values that are not exact
What is population?
The collection of individuals or subjects that are being studied by the researcher
What is a sample?
A subset of the population where the collection is made without bias and the sample is highly representative of the total population
What is a census?
A collection of information from every individual or subject of the population
What is a parameter?
A numerical value or quantity measuring some aspect of the population
What is a statistic?
A numerical value or quantity measuring some aspect of the population
What is distribution?
The variation of data
What are outliers?
Data points that are either too high or too low when compared to the other data points
What is a frequency table?
A chart of the number of times each value occurs
What is a bar graph?
A visual display of data in which quantities are represented by bars of equal width
When are bar graphs used?
Bar graphs are used for discrete data
What is a histogram?
A graph representing ranges of data
When is a histogram used?
A histogram is used with continuous data
How is range calculated?
Max value - min value
How is the number of classes chosen?
Based upon the grapher’s discretion, usually a minimum of 5 bins and a maximum of 15
How is class interval/bin width calculated?
Range/# of classes
What is a class interval or bin?
The ranges of values to encompass continuous data
What is a sampling technique?
A method of selecting a sample that will be representative of the overall population
What are the defining characteristics of simple random sampling?
Every member of the population has an equal change of being selected
The selection of any particular individual does not impact the chances of any other from being chosen
What is the effectiveness of simple random sampling?
Reduction of sample bias
May not be representative of the population, but these derivations are due only to chance
What are the defining characteristics of stratified sampling?
The population is divided into groups or members who share common characteristics such as gender, age, education level, geographic areas, etc. which are called strata
A stratified sample has the same proportion of members from each stratum as the population does
A simple random sample for the members of each stratum is taken
What is the effectiveness of stratified sampling?
Ensures each subgroup within the population receives proper representation'
Many conditions have to be met, so it cannot be used for every study if you cannot classify every member of the population into a stratum
What are the defining characteristics of systematic sampling?
Used to sample a fixed percent of the population
A random starting point is chosen and every individual from that point is determined by:
n = population size ÷ sample size
What is the effectiveness of systematic sampling?
It is simple and is therefore popular among researchers
Low probability of contaminating data
If every nth data point has a random characteristic the sample may disproportionately represent the population
What are the defining characteristics of convenience sampling?
Made up of a conveniently available pool of respondents
Members are chosen based on proximity rather than population representation
What is the effectiveness of convenience sampling?
Commonly used as it is prompt, simple, and economical
Possibility of bias as some groups will be over-represented while others with be under-represented
Since the selection is biased, there will be inaccuracies in the study
What is sampling bias?
Inconsistencies in studies caused by biased selection of samples
What are the defining characteristics of quota sampling?
Survey population is divided into mutually exclusive subgroups
Subgroups are selected with respect to known (non-random) features, traits, or interests
What is the effectiveness of quota sampling?
Inexpensive method of selecting a sample
Guarantees the inclusion of people you need
Participants are not randomly drawn and may have specific characteristics meaning it is impossible to know how well they represent the groups in a population
What is statistical bias?
Any factor that favours certain outcomes on responses, skewing the results, and can be unintentional or deliberate
What is cumulative frequency?
The cumulative frequency of the previous class added to the frequency of the current class that adds to the total frequency
What is relative frequency?
The frequency of a class divided by the total frequency
What is the measure of central tendency?
The measure of the location of the middle of a data with the purpose of describing a set of numerical data using a single value
What are the measures of central tendency for ungrouped data?
Mean, median, and mode
What is the mode?
The value(s) that occur(s) the most often, and can be more than one value depending on the distribution (ex. bimodal distributions)
What is the mean?
The average of a set of values
How is mean calculated?
xˉ = (x ₁ + x ₂ + x ₃ … + x ₙ) ÷ (n)
What measure of central tendency is the most common?
The mean
What is the median?
The middle value in a data distribution
What measure of central tendency do outliers impact?
Mean
What measure of central tendency should be used if outliers are present?
Median
What measure of central tendency should be used if data is mostly symmetric?
Mean or median
What measure of central tendency should be used if frequency is important?
Mode
What measure of central tendency should be used if data is qualitative?
Mode
If a constant is added to each value in a data set, what is the impact on mean and standard deviation?
Mean would increase by the added value but standard deviation would not change
If a constant is multiplied by each value in a data set, what is the impact on mean and standard deviation?
Mean would be multiplied by the value, standard deviation would also increase
What is a weighted mean?
A measure of central tendency that reflects the relative importance of data
What is the formula for weighted mean?
xˉ = (∑ f * x) ÷ (n)
What does x represent in the formula for weighted mean?
The mid-interval value for a class interval
When is weighted mean used?
When a central tendency measurement is required for a set of grouped data
What is another term for a cumulative frequency graph?
An Ogive
How is a cumulative frequency graph built for ungrouped data?
Cumulative frequency is on the y axis and discrete data is on the x axis
How is a cumulative frequency graph built for grouped data?
Cumulative frequency is on the y axis and the upper class limit is on the x axis
What is a cumulative frequency graph used for?
To study the growth rate of data by showing the accumulation of frequency and to determine estimates of the percentiles and quartiles of the data
What are the features of the Ogive?
S-shape used to estimate some values
The ability to determine median by dividing the final cumulative frequency by 2
What are percentiles?
Separations of large ordered data into hundredths
What are quartiles?
Separations of large ordered data into quarters
What is the point showing lower quartile on an Ogive?
The x point when the cumulative frequency is (n + 1) ÷ (4)
What is the point showing the median on an Ogive?
The x point when the cumulative frequency is (n + 1) ÷ (2)
What is the point showing the upper quartile on an Ogive?
The x point when the cumulative frequency is 3 * (n + 1) ÷ 4
What are the points showing percentiles on an Ogive?
The x point when the cumulative frequency is p * (n + 1) ÷ 100
What is the formula for interquartile range (IQR)?
IQR = Q ₃ - Q ₁
What is the measure of spread?
The distance of each data point from the mean
Why is the measure of spread important?
It shows how well a mean represents the rest of the data
When is range used as a measure of spread?
When the sample sizes are small
What is variance?
A method of measuring spread by taking the sum of the squares of the difference between each data point and the average
What is the formula for variance (σ²)
σ² = (∑ (x - xˉ)²) ÷ (n)
What is standard deviation?
An average of the square of the distance of each piece of data from the mean, meaning the smaller the standard deviation, the more compact the data set
What is the formula for standard deviation (σ)
σ = √((∑ (x - xˉ)²) ÷ (n))
Why is standard deviation an approximation?
Because when variables are grouped and the midpoint is used, the spread of observation within the interval is ignored, causing the standard deviation to be lower than the true value
What is a box and whisker plot?
A plot showing the lower extreme, lower quartile, median, upper quartile, and upper extremes of a data set, with a box showing the lower-upper quartiles and whiskers showing the extremes
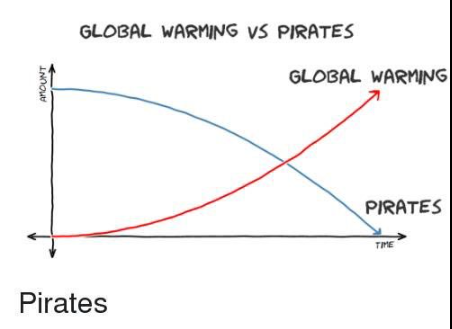
What do pirates and global warming show?
Causation ≠ correlation
What is the name for the values of r corresponding to correlations?
Pearson’s product-moment correlation
How do you draw a regression line?
Start at the mean
Place the ruler on the mean
Align the ruler so that the amount of data points above and below are equal
Draw the line
What is linear regression?
A line of best fit
What are the two equations for lines of best fit?
y on x, y = ax + b
x on y, x = cy + d
How do you find a point (p, q) from a regression line?
Find the mean of x
Find the mean of y
Draw two lines of best fit, one for y = ax +b and another for x = cy + d
Find the point at which line ax + b intersects with line cy + d
The calculated (x,y) coordinate is equal to (p,q)