GDP
Gross Domestic Product
-total value of national output of goods & services produced in a given time period (usually a year or per quarter of a year). There are three ways of calculating GDP
The importance of the concept of ‘value added’
GDP can be analysed in terms of the value of output produced by different industries and also by expenditure on goods and services made by households, businesses and the government. Value added is the increase in market value of goods or services during each stage of production or supply. So, for example, we can measure the value of wheat produced by a farmer; we can then measure the additional value as a miller turns the wheat into flour (but we cannot count the final value of the flour, because this would be ‘double counting’ the value of the original wheat); in turn, we can then measure the additional value as a baker turns the flour into bread.
In summary: Value added = value of production - value of intermediate inputs used in supplying a good
Economic Growth
Short-run growth:
the increase in the real value of goods and services produced and is measured by the annual percentage change in real Gross Domestic Product (GDP)
Long-run growth:
an increase in a country’s productive capacity / potential output
Nominal GDP
the monetary value of the national output of goods and services measured at current prices. We can also say that this is a ‘value’ measurement.
Real GDP
involves taking inflation into account – where money GDP is adjusted for changes in the price level - we say that GDP is measured in constant prices. We can also say that this is a volume measurement.
Real GDP per capita
real income per head of population expressed at constant prices
Real Disposable Income
Income after deduction of taxes + benefits, & adjusted for the effects of inflation
Gross National Income (GNI)
-GDP plus ‘net property income from overseas’
-Remittance money transfers are included in GNI, which will result in higher HDI (human development index) for lower and middle-income countries
Purchasing Power Parity (PPP)
-PPP measures how many units of one country’s currency are needed to buy the same basket of goods and services as can be bought with a given amount of another currency.
-Using measurements of living standards adjusted for PPP will give a much better idea of living standards
Measuring the standard of living
The main indicator for the standard of living is real GNI per capita expressed at purchasing power parity. But there is an intense debate over whether GNI per capita is a sufficiently accurate and reliable measure of improvements in the standard of living and economic well-being for the bulk of a country’s population. Living standards improve when a country sustains a rise in real per capita incomes (GNI) and also when the benefits of growth are widely spread (note - this is also known as inclusive growth).
Key benefits of using real GDP when assessing changes in living standards
-Easy to make comparisons over time (the rate of economic growth)
-Easy to compare different countries, e.g. high and low income countries
-It correlates with other measures of living standards including the Human Development Index
-Having a higher income generally correlates with being able to buy more goods and services (which can include things such as education and healthcare and better housing)
Strategies for improving living standards
-Improving human capital
-Reducing unemployment
-A living wage to lift labour productivity
-Accessible+high quality public services
-Better/affordable housing
-Wealth from successful businesses
Flaws of GDP as a measure of living standards
-Published GDP data is subject to errors in measurement
-GDP tends to understate real national income per capita due to the shadow economy and also the value of unpaid work done by volunteers and people caring for their family. -The shadow economy includes illegal activities such as drug production and distribution, prostitution, theft, fraud and concealed legal activities such as tax evasion on otherwise-legitimate business activities such as non-reported self-employment income
-The UK government estimated the hidden economy “tax gap” at £3.5 billion in 2015-16 ---In 2014 the UK started to include estimates of incomes and spending from the shadow economy in their GDP
Limits of published data as a guide to living standards
Published GNI data hides a number of important aspects
1. Scale and depth of household / regional inequalities of income & wealth
2. Changes in leisure & working hours and overall working conditions – affecting work-life balance
3. Gross Domestic Product makes no allowance for depreciation of capital machinery & technologies
4. Valuation of changes in years of people’s healthy life expectancy
5. Value of non-market output and unpaid work e.g. voluntary care
6. Innovation and improvements in the quality of products we consume including public services
7. Impact of GDP growth on the sustainable stock of our natural resources
8. GDP ignores the quality of goods and services produced; there may be fewer items produced overall if products are high quality and unlikely to break/wear out.
9. Defensive expenditures – e.g. money spent protecting against crime, or cleaning-up the effects of environmental pollution and waste adds to published GDP but has a negative effect on social welfare
10. Doesn’t take into account the amount of household debt / debt-servicing costs
11. How do you measure the value of services such as Google & Instagram, which are consumed for free on the web?
12. A range of other non-monetary factors affect living standards e.g. freedom of speech, gender equality etc.
Inflation
-a sustained increase in the general price level
-measured by the annual percentage change in consumer prices
Deflation
-a fall in the general price level
Disinflation
a slowdown in the rate of increase in prices: i.e. inflation decreasing from 6% to 2%
The Consumer Price Index (CPI)
-the main measure of inflation used in the UK
1)A base year for prices is selected, and a family expenditure survey is carried out – the survey covers many thousands of UK households. The survey tracks what people are buying.
2)A representative basket of over 600 goods and services is used, and weights are attached to each item - based on these items’ importance in people’s expenditure.
3)Each month UK officials collect 120,000 separate price quotations in 141 locations of around 600 products.
4)Weights are then multiplied by price changes
5)The weighted price changes are then totalled to calculate the inflation rate.
Limitations of CPI as a measure of inflation
-The CPI is not fully representative - it will be inaccurate for the ‘non-typical’ household, e.g. 14% of the CPI index is devoted to motoring costs - inapplicable for non-car owners.
-Spending patterns: e.g. Single people have different spending patterns from households that have children
-Changing quality of goods and services: Although the price of a good or service may rise, this may also be accompanied by improvements in quality / performance of the product, which cannot be taken into account by the CPI
-New products: The CPI is slow to respond to new products and services – the CPI basket is changed each year but only a few items fall out or come in for the first time
-Doesn’t account for regional differences in the cost of living
Causes of Inflation
1)Domestic causes of Inflation
-Inflationary pressures within the domestic economy come – for example – from rising wage costs and increases in the costs of component parts of raw materials.
2)External causes of Inflation
-These are inflationary pressures from outside of a particular country – for example arising from an increase in the global price/cost of energy and other inputs
-Movements in the exchange rate of a country’s currency can also affect inflation. For example, if the currency weakens (i.e. becomes cheaper in terms of other currencies) then that will cause imported goods (e.g. raw materials) to become more expensive, pushing up domestic production costs
3)Importance of inflation expectations
-Once inflation becomes established in an economy it can be difficult to remove.
-Most agents (e.g. workers, businesses and lenders) will raise their inflation expectations and build it into their calculations and decisions
-A rise in inflation can lead to an increase in inflation expectations. This can feed through to higher wage claims and rising costs
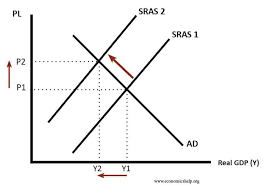
Cost-push inflation
Cost-push inflation occurs when the costs of production for businesses increase; this can include increases in wage costs, the cost of raw materials, rents, or indirect taxes such as VAT. With cost-push inflation, output of goods and services and employment both tend to fall; this is because a rise in costs often leads to a fall in business profits and planned investment spending.
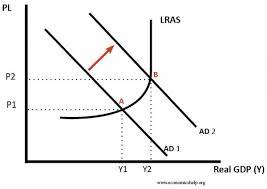
Demand-pull inflation
Demand-pull inflation occurs when total demand for goods and services exceeds total supply. As the economy approaches full employment (or full capacity), labour and raw material shortages occur more frequently which then makes it more difficult for firms to expand production to meet rising demand. Furthermore, when the total demand in the economy rises, it encourages producers to raise their prices and increase their profit margins. This causes the economy’s general price level to rise. The closer to full capacity that the economy gets, the more rapid the increase in the price level.
Growth of the money supply
When an economy’s money supply is increased more quickly than the economy’s growth rate, we can expect there to be inflation. You might sometimes see this expressed as “too much money chasing too few goods”. One theory that has been used to explain this relationship between the money supply and inflation is the quantity theory of money; this can be expressed using the Fisher Formula of MV = PT (where M is the money supply, V is the velocity of money (i.e. how many times it changes hands), P is the price level and T represents the volume of output. We tend to assume that V and T are constant. So, if there is an increase in M then P will rise. Some famous periods of hyperinflation (e.g. Germany in the 1920s and Zimbabwe in 2008) are often attributed to increases in the money supply.
Winners of Rising Inflation
• Workers with strong wage bargaining power (perhaps workers who belong to strong trade unions), because they can usually push for wage increases in line with price increases
• Debtors if real interest rates on loans are negative – the real value of debt may fall (note: real interest rates = nominal interest rates – inflation rate)
• Producers if their prices rise faster than costs
• Wealthy groups if there is a sustained period of asset price inflation
Losers of rising inflation
• Retired people on fixed incomes – inflation erodes the real value of their pensions and other savings
• Lenders if real interest rates on loans are negative
• Savers if real returns on bank deposits are negative
• Workers in low-paid jobs with little or no bargaining power
• Exporting firms may lose sales and profits if they become less competitive – hitting shareholders
Risks of high and volatile inflation
1. Inequality: Inflation has a regressive effect on lower-income families in developed & developing countries – most of their wealth is held in cash
2. Falling real incomes – if wage rises lag behind price increases each year
3. Negative real interest rates: If interest on savings is lower than inflation – this will cut real incomes of savers
4. Cost of borrowing: High inflation may also lead to higher interest rates for businesses and consumers with debts (e.g. Rising mortgage rates)
5. Risks of wage inflation: This leads to rising labour costs and lower profits
6. Business competitiveness: A high relative rate of inflation can reduce competitiveness which will lower demand for the country’s exports in overseas markets
7. Business uncertainty: High and volatile inflation is not good for confidence partly because businesses cannot be sure of what their costs and prices are likely to be. Uncertainty might lead to a fall in capital investment
The effects of high inflation depend on (Evaluation)
1. Whether high inflation is temporary or a persistent problem
2. The rates of inflation in economies of major trading partner/competitor countries – this affects the scale of lost competitiveness
3. The extent to which a country’s central bank is prepared to tolerate inflation without raising interest rates
4. The wage bargaining power of workers in different industries
5. Whether nominal interest rates on savings and loans keep pace with inflation
6. Whether uncertainty leads to a fall in domestic and foreign inward investment
Causes of deflation
Demand-side causes (malign deflation)
• Deep fall in total demand in an economy, causing a persistent recession / depression
• This is usually characterised by a high level of spare capacity
Supply-side causes (benign deflation)
• Improved productivity of labour and capital
• Technological advances in the production process that lowers unit costs
• Falling wage rates
• High (strong) exchange rate causing import prices to fall (causing short run AS to shift outwards)
Economic effects of deflation
1. Holding back on spending: Consumers may postpone demand if they expect prices to fall further in the future. This lowers aggregate demand and can cause a deeper fall in real GDP i.e. prolonged recession
2. Debts increase: The real value of debt rises when there is price deflation and higher real debts can be a big drag on consumer confidence and spending
3. The real cost of borrowing increases: Real interest rates will rise if nominal rates of interest do not fall in line with prices.
4. Lower profit margins: Lower prices reduce revenues and profits for businesses - this can lead to higher unemployment as firms reduce costs by shedding labour.
5. Confidence and saving: Falling asset prices such as price deflation in the housing market hits personal sector wealth and confidence
6. Income distribution: Deflation leads to a redistribution of income from debtors to creditors – but debtors may then default on loans
7. Deflation can make exporters more competitive eventually – but this often comes at a cost i.e. a higher rate of unemployment in the short term
The Labour Force Survey
-Official measure of unemployment in the UK
• This asks around 60,000 households to self-classify as either employed, unemployed or economically inactive.
• In order to be classed as unemployed a person must be:
o Without a job, want a job, have actively sought work in the last four weeks, and are able to start work within the next two week
OR
o Out of work, have found a job and are waiting to start it in the next two weeks
The Claimant Count
• An alternative measure of unemployment is given by the Claimant Count
o This simply counts the number of recipients of Job Seeker’s Allowance (JSA) added to those who must be looking for work in order to claim Universal Credit (UC)
Advantages of Labour Force Survey
1. Because the same methodology is used in many countries, it allows inter-country comparisons
2. The criteria for assessing unemployment has changed very little over time, and so it allows good quality timeseries comparisons
3. It provides a very rich data set on many aspects of the labour market
Disadvantages of Labour Force Survey
1. Because it is a survey of only 60 000 households, there will be sampling errors – and not everyone who is unemployed can be counted
2. It is costly and time-consuming to carry out
3. It is only conducted quarterly, so may not pick up changes in the labour market very quickly
Advantages of Claimant Count
1. Accurate in the sense that an exact number of people who claim unemployment benefit can be calculated – this also makes it an inexpensive measure
2. It is easy to classify whether someone is actively seeking work or not
3. It is easy to see regional / local differences in unemployment patterns
4. The data is produced monthly
Disadvantages of the Claimant Count
1. There are a lot of unemployed people who do not meet the criteria for collecting unemployment benefits (i.e. they are ineligible perhaps because they have savings, or a partner who is in employment, or are under 18)
2. People might be to too proud to claim – part of the problem of calculating the scale of hidden unemployment
Labour force
The number of people of working age who are able, available and willing to work
Economically inactive
Those who are of working age but are neither in work nor actively seeking paid work- note that the economically inactive are not counted as unemployed!
Under-employment
• Looking for an extra job or actively searching for a new job with longer hours to replace their current job
• Preferring to work longer hours in their current job
• Under-utilised in terms of their ability / qualifications / experience
Causes of Unemployment
-Cyclical (Demand-deficient)
• Cyclical or demand-deficient or Keynesian unemployment is caused by weak aggregate demand in the economy, reducing the demand for labour in an economy
• When aggregate demand falls, this will cause a contraction in national output and some businesses may make workers redundant as a result.
• The demand for labour is derived from demand for (and spending on) goods and services
• Cyclical unemployment can rise quickly in a recession, but it can also increase in a period of slow growth
-Frictional unemployment
• Frictional unemployment is caused by workers seeking a better job or who are in-between jobs
• It also affects those people who are new entrants to the labour market such as school and college leavers
• There is always some frictional unemployment in the labour market regardless of the economic cycle
• Frictional unemployment can be reduced by making information on jobs more widely available and also making job search more affordable e.g. with cheaper transport
-Structural unemployment
• Structural unemployment is mainly caused by lack of suitable skills for the jobs available; a result of deindustrialisation or other structural changes in an economy.
• Another phrase that we can use in relation to structural unemployment is occupational immobility – this refers to workers being unable to move between different types of jobs and sectors, usually because of a lack of relevant skills/qualifications
• We can also consider geographical immobility – this occurs when workers are unable to move to find work, perhaps because transport systems are poor, or because of house-price and living-cost differentials (e.g. house prices and the cost of living in London is much higher than in the North East of England, for example, preventing people from the North East from looking for work in London)
• Often people remain unemployed because of disincentive effects including the unemployment trap
The unemployment trap
• This is a situation in which there is little financial incentive for someone who is unemployed to start working because the combined loss of welfare benefits and a need to pay income tax and other direct taxes might result in them being worse off.
• Child care costs can also be a barrier to people finding work.
Seasonal Unemployment
Seasonal unemployment occurs when seasonal workers are without jobs due to the time of year where there are seasonal changes in employment e.g. fruit-pickers in summer, retail jobs pre-Christmas
Seasonality refers to fluctuations in output and sales related to the seasonal of the year. For most products there will be seasonal peaks and troughs in production and/or sales. For example, demand for slippers peaks in the run up to Christmas and demand for plants at garden centres is linked to the planting season.
Long-term unemployment
• Long term unemployment accounts for people who have been out of work for at least one year
• This is a structural problem in the labour market • The longer people are without a job, the harder it is for them to find their way back into employment
• One reason is that people’s skills tend to worsen due to economic inactivity. Motivation to search for a job also suffers the longer someone is out of work.
• This, in turn, can lead to hysteresis – the total amount that can be produced by the labour force actually starts to fall, as workers de-skill
• Employers often favour people with a consistent record of being in work rather than those who have gaps in their CV
• Youth unemployment can be particularly problematic as it can easily become long-term unemployment
Economic and social costs of unemployment
• Slower long-run trend rate of economic growth
• Risks of a period of price deflation because of falling aggregate demand • Rising income inequality
• Erosion of people’s skills (human capital) especially arising from long-term unemployment
• Fiscal (budget) costs to the government as tax revenues shrink and welfare spending increases
• Externalities from social problems
Policies to reduce unemployment
• Macro Stimulus Policies (+ possible positive multiplier effects)
o Low interest rates + improving credit supply to businesses
o Depreciation in the exchange rate (to help exporters)
o Infrastructure investment projects (fiscal policy)
• Cutting the cost of employing extra workers
o Reductions in the rate of national insurance contributions
o Financial support for apprenticeships / paid internships
o Extra funding for regional policy – special economic zones
• Competitiveness Policies
o Reductions in corporation tax (to increase investment)
o Tax incentives for research / innovation spending
o Enterprise policies to encourage new business start-ups
. Reducing occupational mobility
o Better funding for and more effective work training
o Teaching new skills e.g. Coding for gaming, languages
o An expansion of apprenticeship / internship programmes
• Improving geographical mobility
o Rise in house-building to keep property prices lower and encourage more affordable housing rents
o Active regional policy to improve transport infrastructure
• Stimulate stronger work incentives
o Higher minimum wage (now rebranded as a national living wage)
o Increased tax-free allowance of £11,800 from 2018
o Welfare reforms to help reduce the risk of the poverty trap
Economic effects of falling unemployment
Economic and social benefits of falling unemployment
1. Increased employment – which then increases real GDP and helps to lift living standards and demand
2. More people in work – creates extra tax revenues for the government either used to lower the budget deficit / or increase spending (G)
3. Social costs of high unemployment are severe – therefore progress in cutting it has important economic + social benefits
Potential disadvantages of falling unemployment
1. Extra spending from expanding labour market might worsen the current account
2. Risk of an acceleration in demand-pull and cost-push inflationary pressures if unemployment falls rapidly
3. Fewer spare labour will mean a rise in unfilled vacancies; labour shortages might put off some inward investment
Balance of Payments
• The balance of payments (BOP) records all financial transactions made between consumers, businesses and the government in one country with other nations
• Inflows of foreign currency are counted as a positive entry (e.g. exports sold overseas cause money to come into a country)
• Outflows of foreign currency are counted as a negative entry (e.g. imported goods and services cause money to leave the circular flow of income and spending)
• There are three main accounts on the BOP
• The current account of the balance of payments is the main measure of a country’s external trade performance
Components of the current account
-Trade in goods
-Trade in services
-Net primary income
•Flow of profits, interest and dividends from investments in other countries
•Net remittance flows from migrant workers
-Net secondary income
•Overseas aid / debt relief
•UK Payments to the European Union
Effects of a current account deficit
1. Loss of aggregate demand which then causes a slower rate of real GDP growth and thereby reduced living standards
2. Loss of jobs in home-based industries, which may contribute to regional decline and structural unemployment problems
3. Can lead to currency weakness (due to less demand for the currency) and higher inflation, and so a country may run short of vital foreign currency reserves
4. Trade deficit might actually be a reflection/symptom of a lack of competitiveness / supply-side weaknesses
Causes of a current account deficit
Poor price and non-price competitiveness
• Higher relative inflation than a nation’s trading partners
• Low levels of capital investment and research and development spending
• Weaknesses in design, branding, performance and low labour productivity
Strong exchange rate affecting exports and imports
• High currency value increases the prices of exports perhaps causing falling sales
• Appreciating currency also makes imports cheaper, a substitute for home output
Recession in one or more major trade partner countries
• Recession cuts the value of exported goods and services to these countries
• Businesses may find barriers to switching towards markets of faster-growth nations
Volatile global prices (e.g. Commodities)
• Exporters of primary commodities might be hit by a fall in global prices
• Commodity-importing nations could be hit by higher world prices for oil and gas
Booming domestic economy
• Domestic producers need to import more raw materials from abroad
• Households, especially with a high propensity to import, buying more imports due to having more income
Key features of global trade patterns
• Around a quarter of all output produced globally is exported
• Production chains are becoming more complex i.e. a final good might have been made in many stages across many countries; around 30% of global exports have been made from imported goods/services
• Bilateral trade is becoming increasingly more important i.e. if country A exports to country B then B is also likely to export to country A – trade is rarely “unilateral” (in one direction)
• Until the 1970s, a significant proportion of trade was between rich countries, but there is now much more trade between rich and poor countries, and between poor countries
• China, the US, Germany, France and Japan account for just under 40% of all international trade
• China remains the economy with the largest value of trade, but its share is falling – it is currently around 11%