Flashcards with answers for papers
Data/Examples of Data
a collection of unprocessed items.
Examples of Data:
include text, numbers, images audio, video
Information/Examples of information
is processed data that conveys meaning.
Examples of information:
Grocery list
A recipe
Directions
Sources of information and Characteristic of each source
books - comprehensive (depth), not very current
journals – reliable, authoritative, current, have depth
magazines – current, may incur cost
newspapers – available, current, little or no cost, needs to be evaluated, may not have depth
online libraries/electronic databases – reliable, may be costly
websites - Interesting, informative, sometimes biased.
people – available, relevant, not the most reliable
Characteristics for selecting information
how appropriate or relevant the information is (e.g. does information is (e.g. does information exist on the country or area in which the research is to be done, it is related to the age group being studied),
whether multiple sources are required (e.g. background information may come from journals and students could be surveyed or interviewed to obtain primary information),
the amount of depth required (e.g. will students need to interviewed, will only a small number of schools be selected or will it be an island-wide survey),
the audience for a publication, stakeholders in the Health Ministry or the entire country at large)
Conducting of research and presentation of findings. Automated information processing cycle includes the following steps:
- (input) - Data captured or entered from surveys/questionnaires/interviews or observations
- (processing) for example, data needs to be analysed,
- (Storage) data stored for later use
- (Output/transmit) information presented using charts, graphs, diagrams etc.;
- (Feedback/ data and information can be evaluated/updated via the input stage
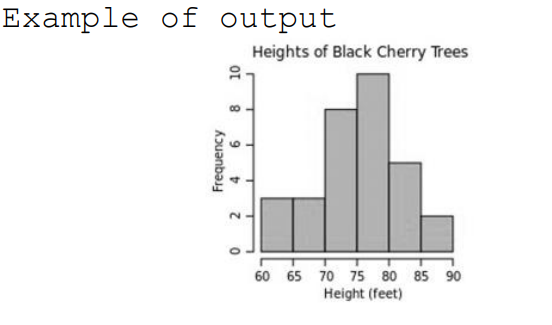
Graphical illustration of representation
Chart or graph depicting some output
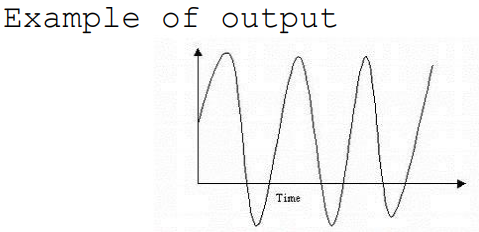
Analogue illustration of representation
Examples of analogue output:
Sound (bell ringing)
Siren (blinking lights of siren)
Internet research tools and reasons for usage
search engine
social media tools
conferencing tools
cross-platform messaging tools
Reasons: Appropriate, timely, current, reliable
Information Technology careers
computing
software engineering
computer engineering
Information systems
professional organisations:
IEEE (Institute of Electrical and Electronics Engineers)
BCS (British Computer Society)
ACM (Association for Computing Machinery)
AIS (Applied Information Sciences)
Roles of users as a component of an IT system:
Users provide input to the system (1 mark) (via various devices) for the correct functioning of the system (1 mark)
Users receive output from the system (1 mark) via various output devices and formats (1 mark) and interpret these outputs
Users monitor the system (1 mark) to detect problems (1 mark) OR provide solutions/decision-making and feedback when problems occur (1 mark)
human computer interaction or interface (HCI)
The section of software which defines how a user interacts/works with/responds to a computer
Types of HCI and description
Command Line (1 mark): instructions or commands (1 mark) are typed from a console
OR No (1 mark) option to choose an item from a menu or selecting an icon (1 mark) (any key terms in description = 1 mark)
Menu driven (1 mark): provides a list of options similar to a meal menu (1 mark), user makes a selection in order to activate a process (1 mark). (any key terms in description = 1 mark)
Graphical User Interface (1 mark): uses pointers or pointing devices (1 mark), icons, menus, desktop and other computer graphics capabilities to facilitate a process / communicate with users (1 mark).
Pros of a command line
Command line (1 mark): accesses a computer's operating system or an application faster (1 mark); uses less memory (1 mark); a set of commands can be linked together or typed in a batch file (1 mark) to achieve a range of results
Network used to remotely access the computer network
A Virtual private network (VPN) (1 mark); it provides a user with a secure connection to a company network.
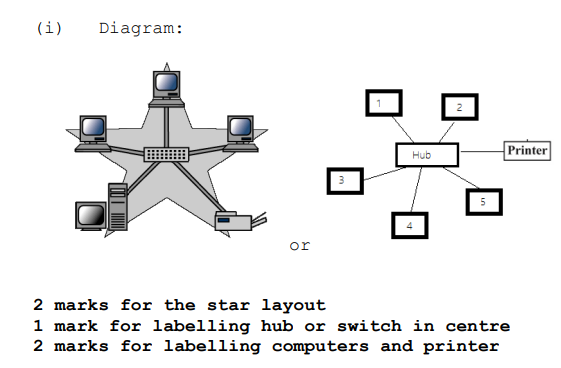
Diagram of a network topology that would allow the computers and printer to be connected in such a way that the failure of any one of the computers (or its connection) will not affect the function of the network as a whole.
Star topology
Star topology - why it would be able to prevent network failure in the event that one computer (or its connection) fails.
It depends on the central node called a hub or a switch for the transmission of data. All data is passed through this device so that the network is not dependent on inter computer connections for communication. (1 mark)
Encryption concept
coding or scrambling of information (1 mark) so that it can only be decoded (1 mark) and read by someone who has the correct decoding key; used in secure documents. (1 mark)
Authentication
individual, company, entity or account holder has their identity confirmed to allow access to accounts and services. (1 mark) It usually refers to the entry of a series of username and password, PIN codes, security keys, commands or biometric data for comparison and matching or verification to information (1 mark) stored in a database.
Logical access control measure/example of it
access is reduced through procedures and security principles, limited privileges and segregation of duties
Example:
(user id) and password
encryption
antivirus software
firewall software,
Physical access control measure'/example of it
a tangible (capable of being touched) measure or device is used to allow someone to gain access to the computer system
Examples:
lock
swipe card
firewall hardware
biometric device
Dataflow Diagram (DFD) is an important software engineering tool. Define DFD.
A DFD is a graphical representation (1 mark) used to show the flow of data (1 mark) through an information system.
Context level (Level 0) DFD characteristics
1. Shows the system as a large, single process
2. Little or no detail about the internal operations of the system
3. Does not generally show data stores
4. Shows data stores only when they are owned by external systems.
5. Most basic dfds
Level 1 DFD characteristics
1. Describes a system with much more detail
2. Showing individual sub-systems
3. Shows data stores needed
4. How data flows between various parts of the system
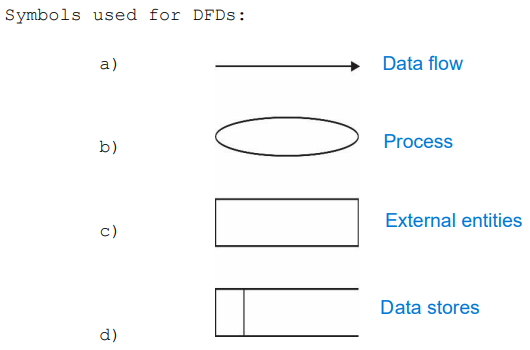
Symbols used for DFDs
Description of control structures that can be used in developing an algorithm.
Repetitive Control Structures - shows loops that execute code multiple times based on conditions.
Sequence: shows the next processing step; is usually simple
Selection: demonstrates that a choice is being made
Recursive: a call by the function to repeat itself
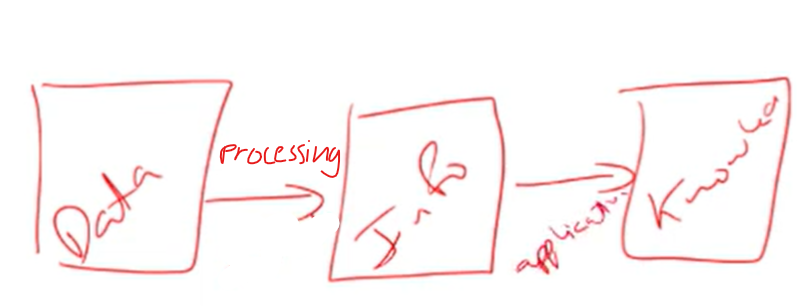
Labelled diagram showing the relationship among knowledge, data and information
A wiki is an example of an electronic info source. Define “wiki”
A wiki is a website, an online information source, from which anyone who accesses it can edit the contents of the webpage.
Disadvantages of a wiki
Anyone can edit the website and falsify it.
Information may not be up to date.
Information may not be credible or reliable.
Wiki navigating and editing can be intimidating for newcomers, potentially limiting diverse contributions.
Advantages of a wiki
Allows multiple users to edit together.
Supports collaboration for remote teams.
Tracks changes and edit history.
Affordable or open-source options available.
Centralized info accessible from anywhere.
Definition/purpose of a context level diagram
Show the overall functions and purposes of a software system by illustrating its interactions with external entities and the flow of data between them.
Definition/purpose of a level 1 diagram
shows a more detailed outline of how data flows within a software system by breaking down the processes identified in the context level diagram into smaller subprocesses and showing the interactions between them. Additionally, it also typically shows where data is stored within the system, such as in data stores or databases.