
Unit 2 - Environmental research and data collection
2.1 The scientific method
Scientific method involves the interplay between observations and the formation, testing and evaluation of hypotheses
Hypotheses are based on observations/experimental data
Consistently supported by investigation + observation → theory
Investigations need controlled variables + to collect quantitative results
IV = what is changing
DV = what you’re measuring
Some limitations to a study include: limited sample size, sampling/selection process, demographic, area of study → uncertainty in results
2.2 Environmental research in the context of climate change
Reliability: obtain the same result each time a measurement method is carried out
Peer-reviewed & repeated experiments strengthen the results of an investigation
Bias: systematic deviation between data interpretations and accurate description
Personal: scientist seeks to personally benefit from research/support their ideology
Institutional: organization interprets data to enhance its power
Misuse of data due to bias → unreliable data (in favor of one conclusion + inaccurate)
Historical data developed by: development in scientific theory + technological advancements
Limited amount of historical data
Unreliable data has led to false reporting of scientific conclusions
Limited amount of data
Lack of public + media knowledge
Uncertainty in climate models
2.3 Collection of environmental data
Sampling strategies are used to collect representative data
Random sampling: equal chance of selection for research
Systematic sampling: follows an interval
Random sampling + systematic sampling strategies → ensure samples are well distributed w/ low risk of bias
Suitability of the strategies is due to: size, ease of access, & knowledge of the environment
Random vs. systematic sampling can be determined by:
Precision: random = equal chance of selection; systematic = possible sampling errors
Bias: random = reduces bias; systematic = possible data manipulation
Efficiency: random = time-consuming for large populations; systematic = faster & less expensive
2.4 Data collection techniques and data analysis
ALWAYS IDENTIFY A LOCATION TO SAMPLE - WHETHER ITS RANDOM OR NOT
Quadrats: state size of quadrat (e.g. 1m x 1m), sampling distances (e.g. every 5 m), count the organisms collected, repeat & average
Limitation: used for small animals & animals that don’t move much
ACFOR: estimates abundance
Limitations: biased, qualitative, over/under estimations
Pitfall traps: placed on the ground to collect crawling animals (assesses abundance + biodiversity)
Benefits: simple to set up & inexpensive
Limitations: don’t work with flying animals & time-consuming
Sweep nets: collect samples of orthopods from grassy/bushy areas
Benefits: inexpensive, easy to use, doesn’t harm insects
Weaknesses: net easily damaged & time-consuming
Beating trays: select a branch, shake the branch, collect falling insects on tray, count insects, count # of branches, multiply # of insects by # of branches
Benefits: can collect a sample in a quick manner; may release hidden insects
Limitations: only useful for certain species - might miss ground dwellers
Kick sampling: use a net, open the net against the direction of flow, set period of time, count organisms, & repeat (e.g. in different location), average
Benefits: simple to use, inexpensive
Limitations: only useful in shallow bodies, vary with time of year + temp
Light traps: capture nocturnal arthropods using a light source + capture sheet
Limitations: only effective in very dark areas
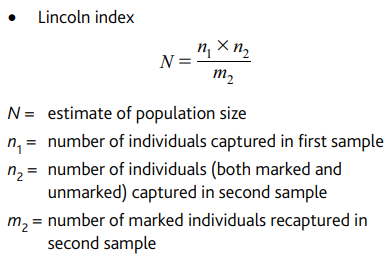
Capture-mark-recapture: randomly capture animals & tag them (e.g. chips), recapture them, then use Lincoln Index to estimate population
Weakness: assumes no changes in population (e.g. migration, births, deaths)
Water turbidity: measures the level of particles in a body of water
Questionnaires: research method using written questions (contains open & closed questions)
Limitations: amount of data (too much/too little), possible bias, data might not be representative, can’t verify data

2.5 The use of technology in data collection & analysis
Methods of data collections that use technology:
Geospatial systems
Satellite sensors
Radio tracking
Computer modelling
Crowdsourcing
Big data: a large amount of data that is collected rapidly using technology
Benefits: efficient (less time consuming), stores a lot of data, wide application of uses (e.g. healthcare)
Limitations: limited human input, data may be unreliable, people can rely to heavily on the data