


Chapter 20: Autosomal Short Tandem Repeat Profiling
Short Tandem Repeat (STR): A region of genomic DNA containing an array of short repeating sequences.
It is also called microsatellites or simple sequence repeats.
STR loci have many advantages compared to VNTR loci:
STR loci can be amplified by PCR.
STR profiling can be carried out for degraded DNA samples.
Preferential amplification is reduced at STR loci.
The resolution of electrophoretic separation of STR fragments is superior.
STR loci are suitable for multiplex amplification.
20.1: Characteristics of STR Loci
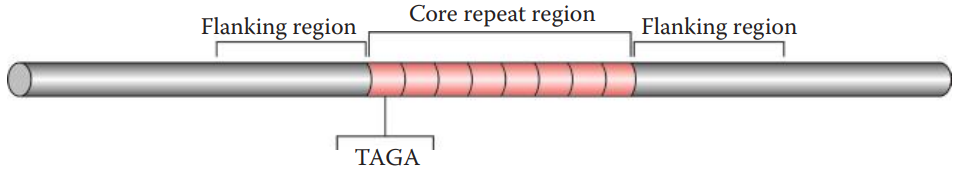
Core Repeat and Flanking Regions
The core repeat region of each STR locus contains tandemly repeated sequences.
The designation of genotypes for human identification is based on the number of tandem repeat units at a STR locus, which varies among human individuals.
The flanking regions surrounding the core repeat region are also needed for STR analysis.
PCR primers complementary to these flanking regions are used, allowing the core repeat regions to be amplified.
Repeat Unit Length
Repeat Unit Length: The number of nucleotides in a single repeat unit.
Dimeric, trimeric, tetrameric, pentameric, and hexameric repeat units appear in the human genome.
The pentameric and hexameric repeats are very polymorphic. Only a few pentameric and hexameric repeats are used for forensic applications because they are less abundant in the human genome.
Repeat Unit Sequences
Simple Repeats: Consists of tandem repeats with identical repeat unit sequences.
Allele designation is based on the number of repeat units in the core repeat region.
Complex repeats: Contain several clusters of different tandem repeats with intervening sequences.
Nonconsensus alleles with partial repeat units also appear in the population. These nonconsensus alleles, also known as microvariants, differ from common alleles by one or more nucleotides.
20.2: STR Loci Commonly Used for Forensic DNA Profiling
STR loci were initially utilized for genetic studies and were later applied to forensic DNA profiling.
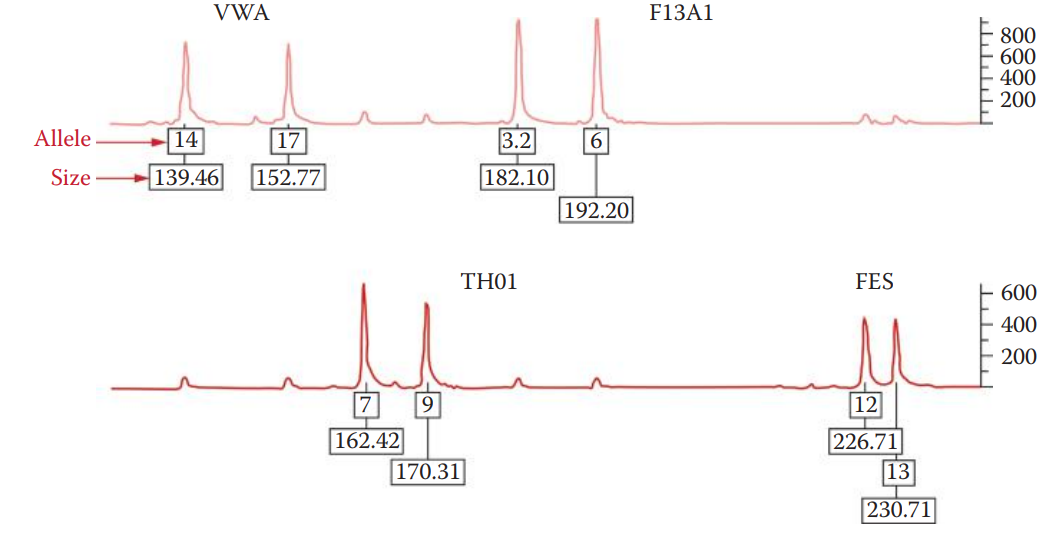
Quadruplex: The first STR multiplex system, developed by Forensic Science Services in the United Kingdom.
Consists of four loci: F13A1, FES, TH01, and VWA.
Second-Generation Multiplex (SGM): The first national DNA database established in the United Kingdom.
Consists of six STR loci: D8S1179, D18S51, D21S11, FGA, TH01, and VWA.
European Standard Set (ESS)
Consists of seven loci: TH01, VWA, FGA, D21S11, D3S1358, D8S1179, and D18S51.
Combined DNA Index System (CODIS): Established by the FBI.
It contains 13 core STR loci plus the amelogenin sex-typing locus.
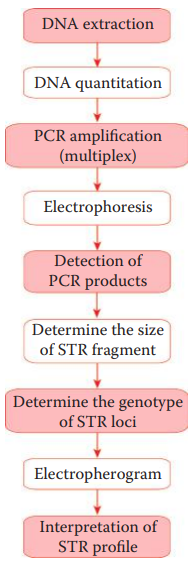
20.3: Forensic STR Analysis
STR loci are amplified using fluorescent dye-labeled primers.
A multiplex STR system utilizes multiple fluorescent dyes to label each amplicon.
The amplicons are separated via electrophoresis.
The different fluorescent dye colors are resolved by the detector, and the signals corresponding to each DNA fragment are identified using specialized computer software.
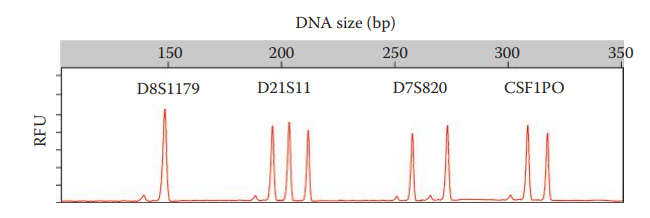
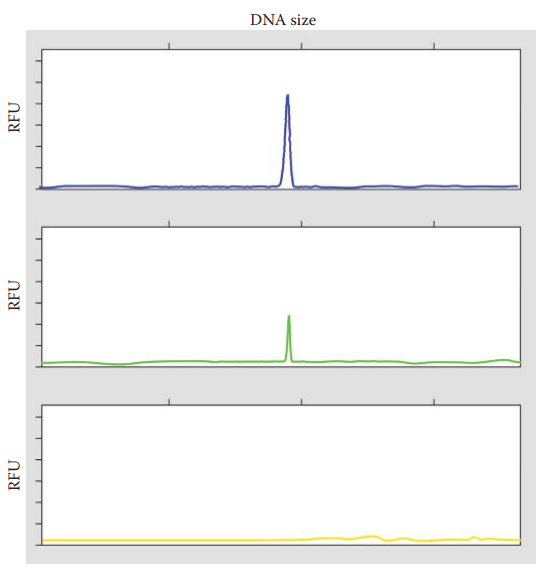
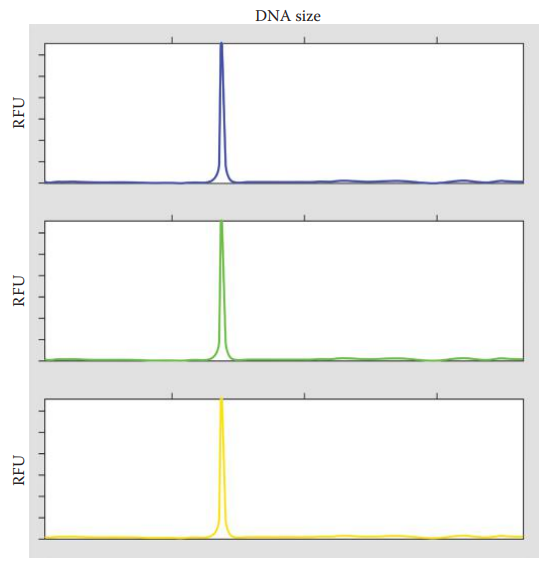
The data collection process generates an electropherogram that shows a profile of peaks corresponding to each DNA fragment.
The positions of these peaks represent the electrophoretic mobility of the DNA fragments.
A small fragment, migrating faster than a large one, peaks earlier in the electropherogram than a longer fragment. The DNA fragments are sized by comparison to an internal size standard.
Determining the Genotypes of STR Fragments
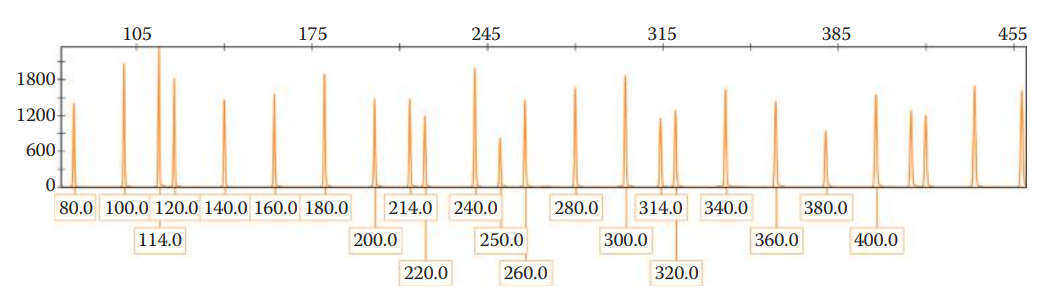
The genotype is determined by using an allelic ladder, which is important to achieve accurate genotype profiling.
Allelic Ladder: A collection of synthetic fragments corresponding to common alleles observed in the human population for a given set of STR loci.
The sizes of DNA fragments of a sample are correlated to the sizes of fragments for each allele in an allelic ladder in order to determine the allele designation of a questioned sample.
If a rare allele fails to match alleles within an allelic ladder, it is considered an off-ladder allele.
If an off-ladder allele is present, the sample should be reanalyzed.
Interpretation of STR Profiling Results
Inclusion (Match): Peaks of compared STR loci, such as those between the profiles of suspect and crime scene evidence or victim and crime scene evidence, show identical genotypes.
Exclusion: The genotypes of two or more samples differ, and the profile of the sample is determined to be an exclusion, meaning that the profiles originated from different sources.
Inconclusive Result: The data do not support a conclusion of inclusion or exclusion. In other words, insufficient information is available to reach a conclusion.
20.4: Factors Affecting Genotyping Results
Mutations
Mutations at STR Core Repeat Regions
If a mutation occurs in the germ cells, the mutant allele will be transmitted to and be present in all cell types of the progeny.
Germ-Line Mutation: A type of inheritable mutation in the germ cell lineage.
The frequency of germ-line mutation can be measured by the mutation rate, expressed as the number of mutations per generation.
Somatic Mutations: Involves the mutation of only somatic cells.
Chromosomal and Gene Duplications
Trisomy: Duplicating one of the homologous chromosomes results in a total of three copies of a particular chromosome.
If the duplicated locus is mutated, a triallelic or three-peaks pattern can be detected at a single locus, but not at loci located at other chromosomes in a multiplex STR profile.
Point Mutations
It involves the changing of a nucleotide sequence through nucleotide substitution, insertion, or deletion.
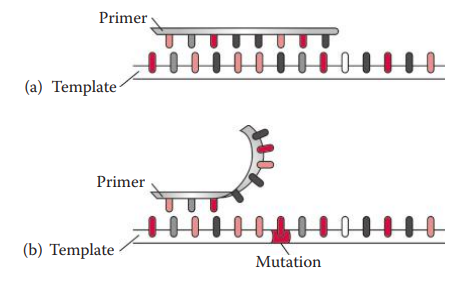
Null Allele: If a mutation at a primer-binding sequence prevents the primer from annealing to the template, this leads to a complete failure of the amplification of the allele.
Amplification Artifacts
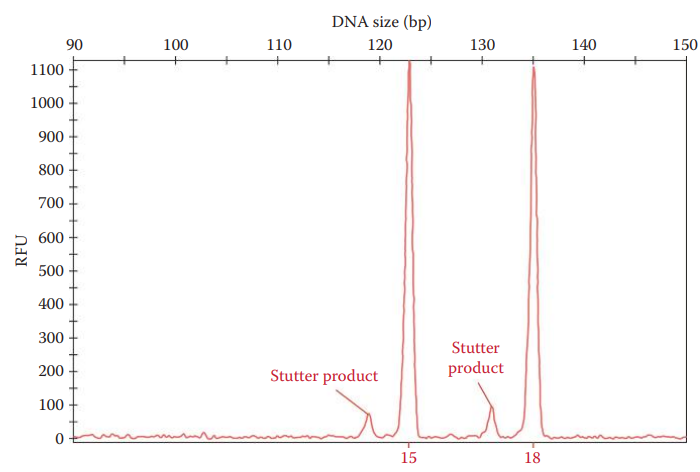
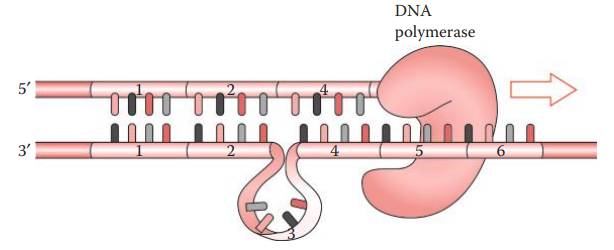
Stuttering
Stutter: A minor allele peak, whose repeat units are shorter or longer than the parental allele peak.
Stutter Ratio: The area of the stutter peak divided by the area of the parental peak.
Nontemplate Adenylation
During PCR amplification, DNA polymerase often adds an extra nucleotide, usually adenosine, to the 3′-end of an amplicon.
It results in an amplicon that is one base pair longer than the parental allele.
Heterozygote Imbalance
It occurs when one of the alleles has a greater peak area or amplitude than the other allele within the same locus in which the two alleles of a heterozygote are compared.
Preferential amplification: Refers to an event where a smaller allele is amplified more efficiently than larger ones.
Allelic Dropout: It occurs when an allele, usually one of the heterozygote alleles, fails to be detected.
Electrophoretic Artifacts
Pull-Up Peaks: Occurs when a minor peak of one color on an electropherogram is pulled up from a major allelic peak in another color when the colors have overlapping spectra.
Spikes: These are sharp peaks that are present in all color panels of an electropherogram. It is caused by by air bubbles and urea crystals in the capillary of an electrophoretic platform.
20.5: Genotyping of Challenging Forensic Samples
Degraded DNA
Environmental exposure, such as high humidity and temperature, of biological evidence can lead to DNA degradation such as the breaking of DNA molecules into small fragments.
The more severe the degradation, the more intensive the fragmentation.
When a sample experiences some degradation, large alleles are less likely to be amplified than small alleles.
As a result, the dropout of large alleles often occurs, leading to a partial DNA profile or even a failure in obtaining a DNA profile.
The PCR primers can be redesigned to anneal more proximally to the STR core repeat region than standard STR primers, yielding small amplicons also known as miniSTRs.
Low Copy Number DNA Testing
It involves the testing of very small amounts of DNA in a sample.
It is often needed for samples derived from evidence such as fingerprints and tools and weapons handled by perpetrators.
STR analysis of extremely low levels of human DNA can be achieved by increasing the number of PCR cycles to improve the yield of amplicons, thus improving the sensitivity of the analysis.
Mixtures
Mixture Interpretation: The interpretation of DNA profiles of mixed stains.
To determine the presence of a mixture: First, determine whether the source of the DNA in the sample came from one or more individuals by examining the number of alleles at multiple loci. The characteristics listed below usually indicate a mixture:
Severe heterozygote imbalance.
Stutter ratio above 0.15.
Presence of three or more alleles per locus at multiple loci.
To determine the genotypes of all alleles and to identify the number of contributors: Note that the maximum number of alleles at any given locus is two per individual. In the case of homozygous or allele overlap, the number of alleles observed can be less than two per individual.
To estimate the ratios of the contributions: Determine the relative ratios of the contributions to the mixture made by each individual by comparing the peak areas or amplitudes.
To consider all possible genotype combinations: This may be done by pair-wise comparisons to determine the allele combinations that belong to the minor contributor and those that belong to the major contributor.
To compare reference samples: The final step is to compare the genotype profiles with the genotypes of reference samples from a suspect and victim. If the DNA profile of the suspect’s reference sample matches a major or minor component of the mixture, the suspect cannot be excluded as a contributor.